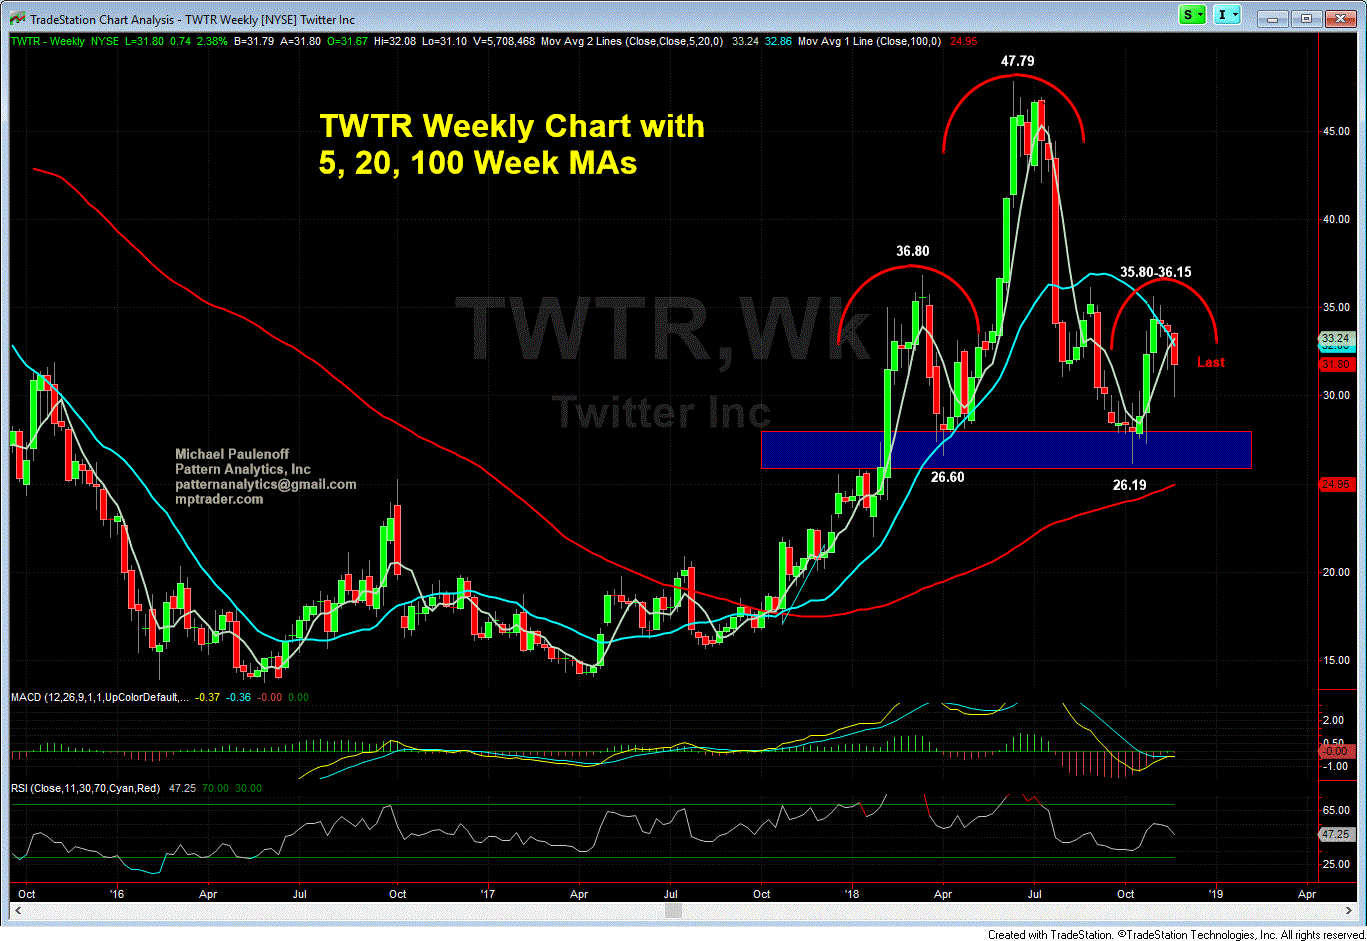
What in the World is the Longer Term TWTR Chart Telling Us? Hint: Nothing Good
TWTR-- deserves and requires more than a one-liner. Wow, what a chart! My attached Weekly Chart shows a massive Head & Shoulders Top Formation that is in the process of carving out a Right Shoulder between 36 on the high side and 27 on the low side.
The implication from the pattern indicates that if for whatever reason TWTR declines beneath 26-27 support, it will be vulnerable to powerful forces of long liquidation that sends the stock towards 12-15 optimally, and possibly to SINGLE DIGITS thereafter.
If Left-Right Shoulder time symmetry is equal, then 10-12 weeks will be needed to complete the Right Shoulder, which means another 3-5 weeks from now, or mid-to-late December before TWTR will be extremely vulnerable to acute selling pressure.
Only a climb above 36-37 will invalidate the Top Formation...
Anyone have some thoughts about what conditions or fundamentals would send TWTR into an existential tailspin?
Last is 31.54/65

