What is All This Volatility Telling Us in ES?
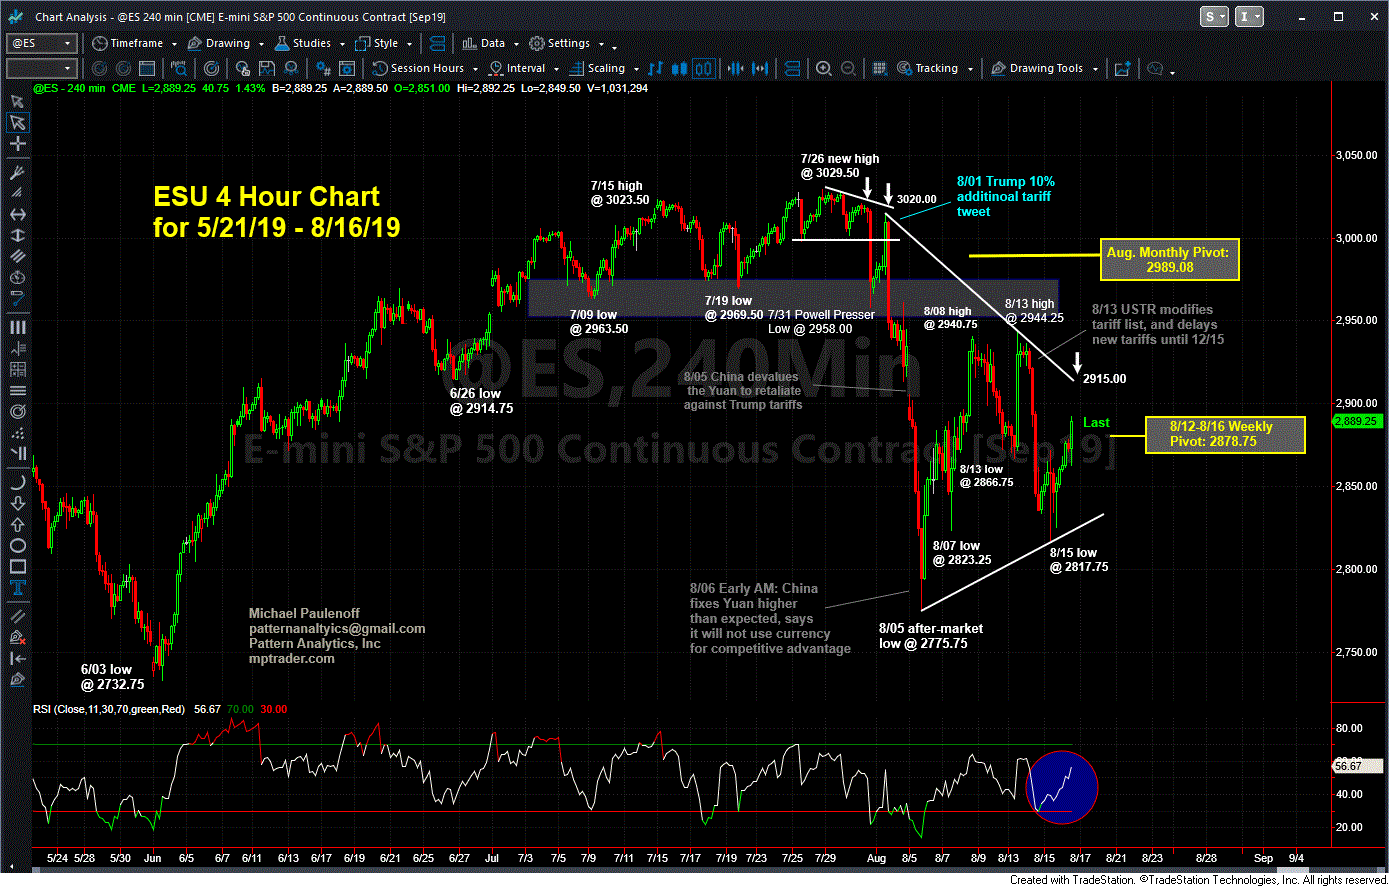
ES approaching the Noon hour, from the perspective of my 4 hour chart, puts a lot into perspective, namely, that all of the wild swings during the last two weeks (8/05 to 8/16) has all occurred within a (5%) range from 2940/45 on the high side to 2800/20 on the low side, with today's strength placing ES circling the mid-point of the wide range.
From a pattern perspective, we really don't know if all of the action off of the 8/05 spike low at 2777.75 is a sideways, bearish digestion period beneath the July Top (2950 to 3030), which when complete, will resolve itself into another corrective downleg, OR if all of the action off of 8/05 is a bottom effort after a completed pullback from 3029.50 to 2775.75?
For the time being, although ES has room to climb to 2915/20 from here, my larger-pattern bias is to the downside, anticipating another roll over that presses ES to 2660/80.
Last is 2886.50

