What is with Gold and the Full Moon?
 By
Mike Paulenoff
By
Mike Paulenoff
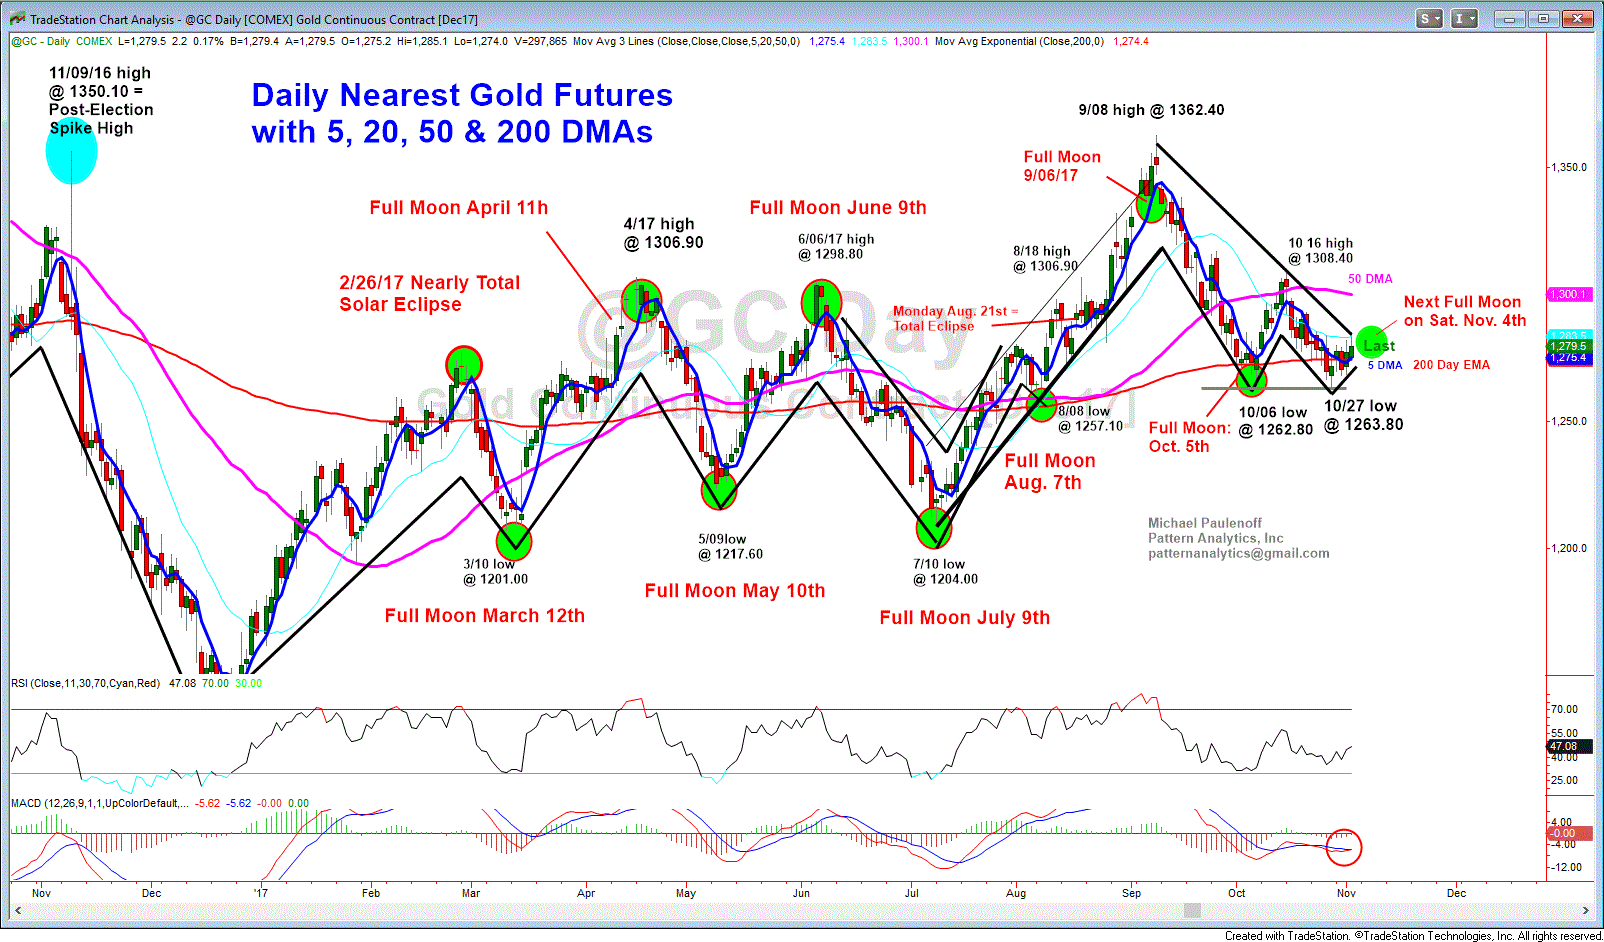
Time to check in on Dec. Gold, which is up a couple of bucks today as it continues to attempt to hold above its 200 DMA (1274.40), and its Oct. Double Bottom lows at 1262.80 and 1263.80 ahead of another Full Moon this Saturday.
One of the quirky behaviors of Gold this year so far has been directional reversals around the time of Full Moons, as we see from the attached daily Dec. Gold chart. Although the reaction to the Oct. 5th Full Moon has been neutral at best, or perhaps described as a failed rally effort, maybe that price action suggests that the reaction to the next Full Moon will be positive? Who knows? I just bring up the timing of the next Full Moon on Nov. 4th to alert you to a potential directional catalyst.
Back down on Earth, Dec. Gold is wedged-in between resistance along its Sep.-Nov. down trendline at 1284.00 on the high side, juxtaposed against the Oct. Double Bottom on the low side (1262.60-1263.80) . Strength that takes out 1284 on a sustained (closing) basis will trigger upside projections to test the 10/16 high at 1308.40. Conversely, a break of the Double Bottom will point Dec. Gold to 1230-1220.