What's Next For Tesla (TSLA)?
TSLA remains an extremely fascinating company both fundamentally (software or hardware, or both?), and technically. I will defer to others on the subject of valuations, et al.
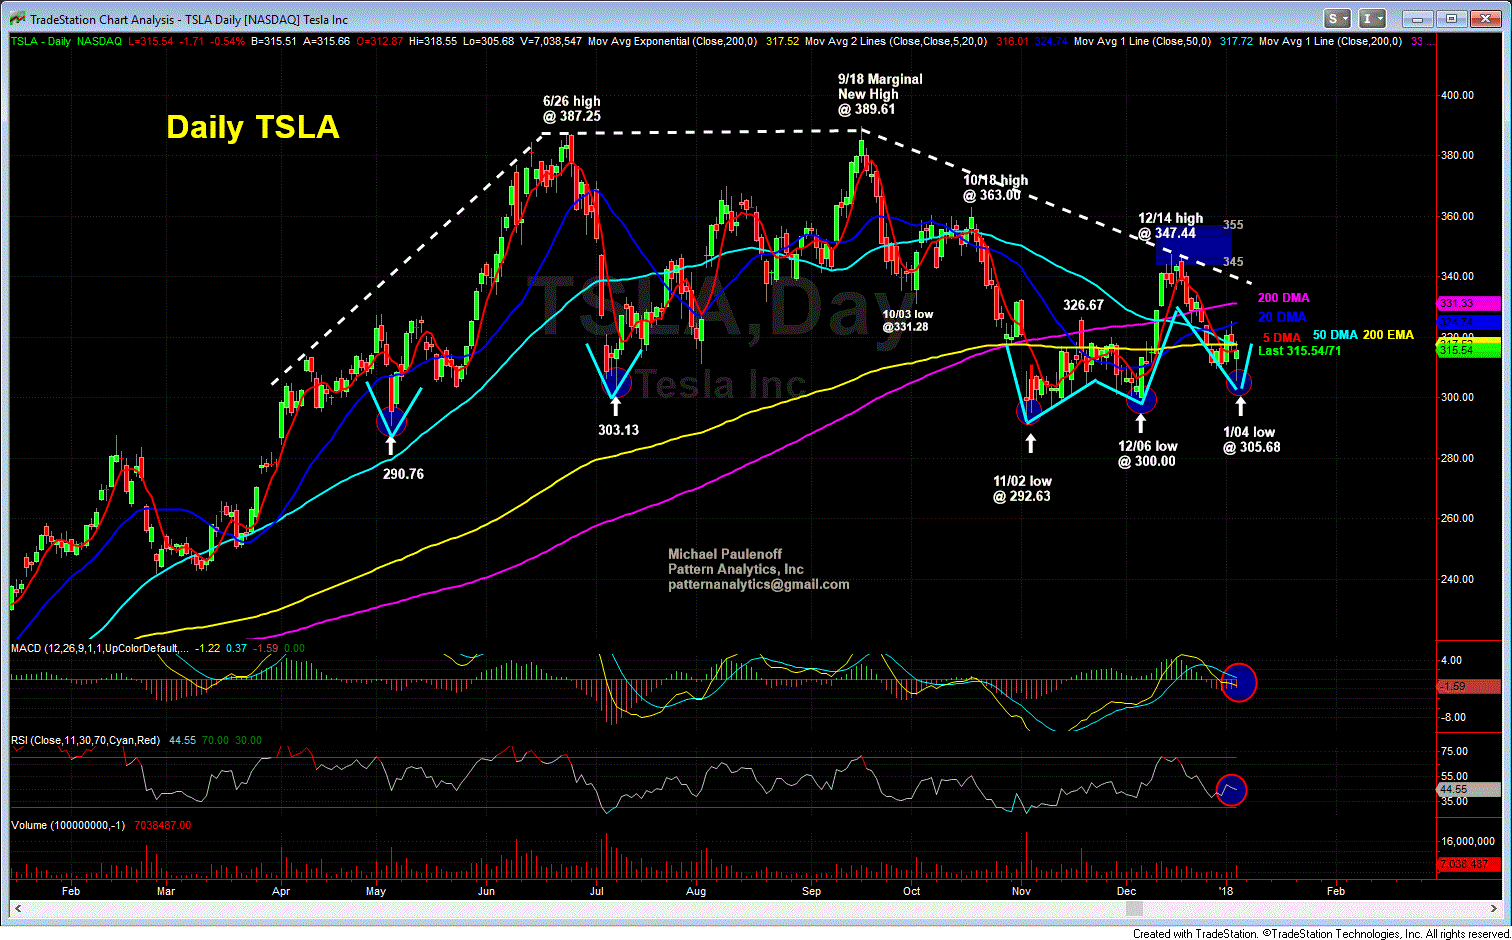
I will focus on the BIG picture technical set up of TSLA as we enter 2018. If we step back the screen, and look at the attached daily chart from a distance, it is difficult to view the multi-month price pattern as anything other than a BIG Distribution Top Formation that manages to find buying interest any and every time the price structure presses into the 300-290 area, which has thwarted weakness on five occasions since May 2017.
As long as 290-300 contains any forthcoming weakness, TSLA is a HOLD. To morph from HOLD to BUY, the price structure must claw its way above a cluster of Moving Average resistance concentrated in the vicinity of 316-2317, and again in the vicinity of 325-330. In other words, the 315 to 330 zone will be considered TSLA's battleground for directional control. Above 330, TSLA's technical set up will improve significantly for an intermediate term advance to new all time highs at and above 400. Conversely, inability to climb above 330 followed by a decline that presses to 300 or lower will place the price structure in a potentially precarious position that threatens to unleash the negativity of a major top that could send TSLA towards 200 in a hurry. MJP

