Where Has All The Volatility Gone?
 By
Mike Paulenoff
By
Mike Paulenoff
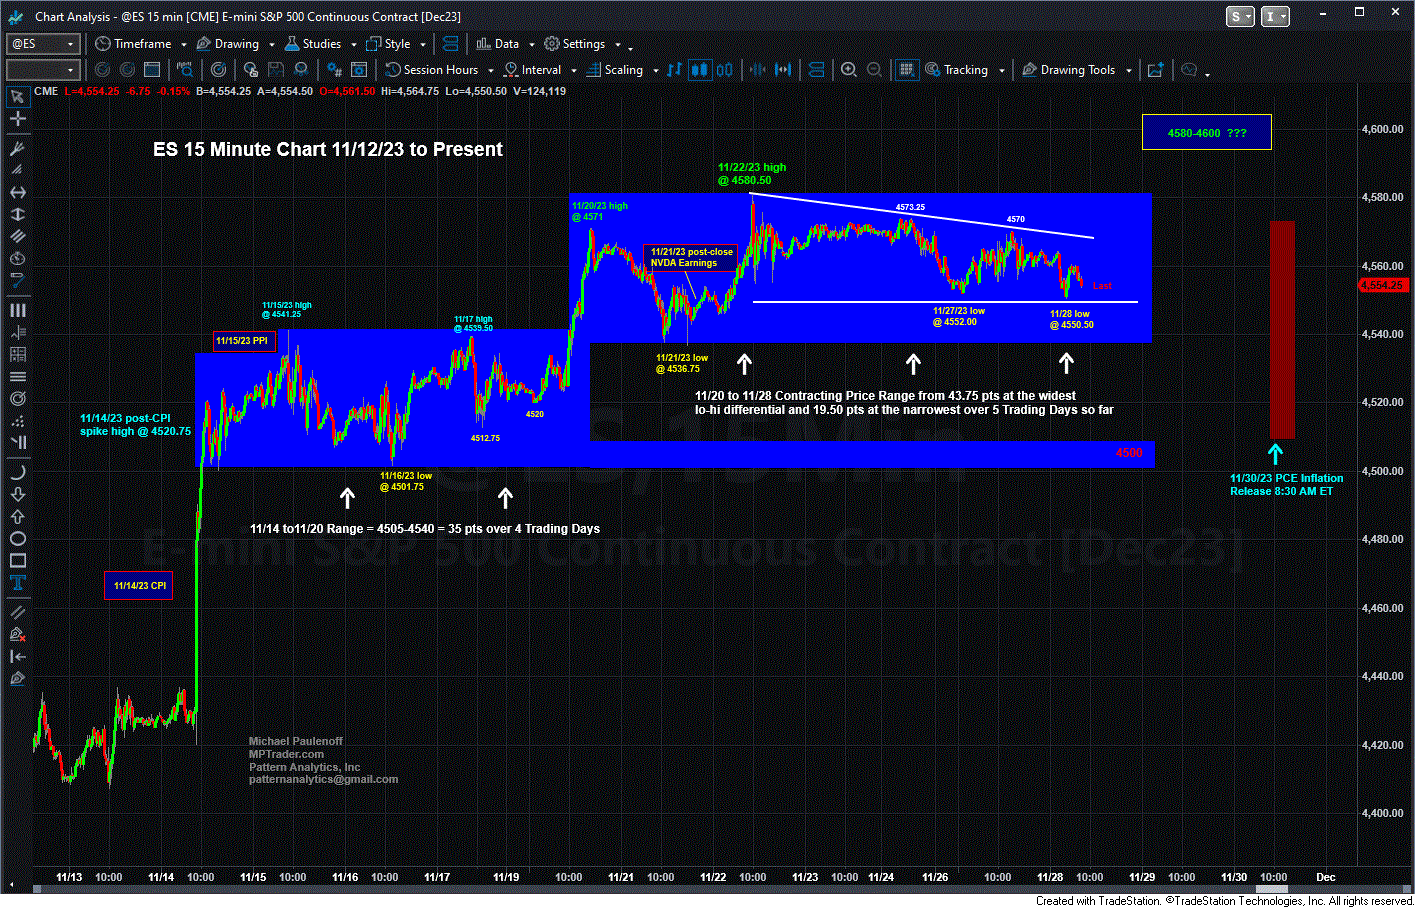
Good Tuesday Morning, MPTraders! November 28, 2023-- Pre-Market Update: Where has all the volatility gone?
My attached 15-minute ES Chart shows that since the explosive vertical upmove in reaction to cooler-than-expected CPI data on 11/145, the index has carved out two multi-day sideways rangebound periods right into this morning's price action.
From the low side of the first range at 4500 to the high of the second range at 4580.50, ES has climbed 1.8%, but if a trader happened not to capture the entire low to high range, then ES has traversed ranges of about 0.8 for the past two calendar weeks.
Is this behavior bullish or indicative of upside exhaustion atop a 10%-11% October-November upmove?
My sense is that it is neither. As long as any forthcoming weakness is contained above 4500 as a worst-case decline (without triggering near-term sell signals in my work), I think that ES is levitating ahead of Thursday AM's inflation report from the Personal Consumption Expenditures (PCE) data. In the absence of a sell signal triggered on a sustained breach of 4500, my preferred scenario argues for a positive reaction to continued progress on "disinflation" as expressed by the PCE data that will propel ES from somewhere north of 4500 to new post-October highs above 4580.50 to a challenge of 4600 next... Last is 4552.00