Yield Hits Multi-Year High
 By
Mike Paulenoff
By
Mike Paulenoff
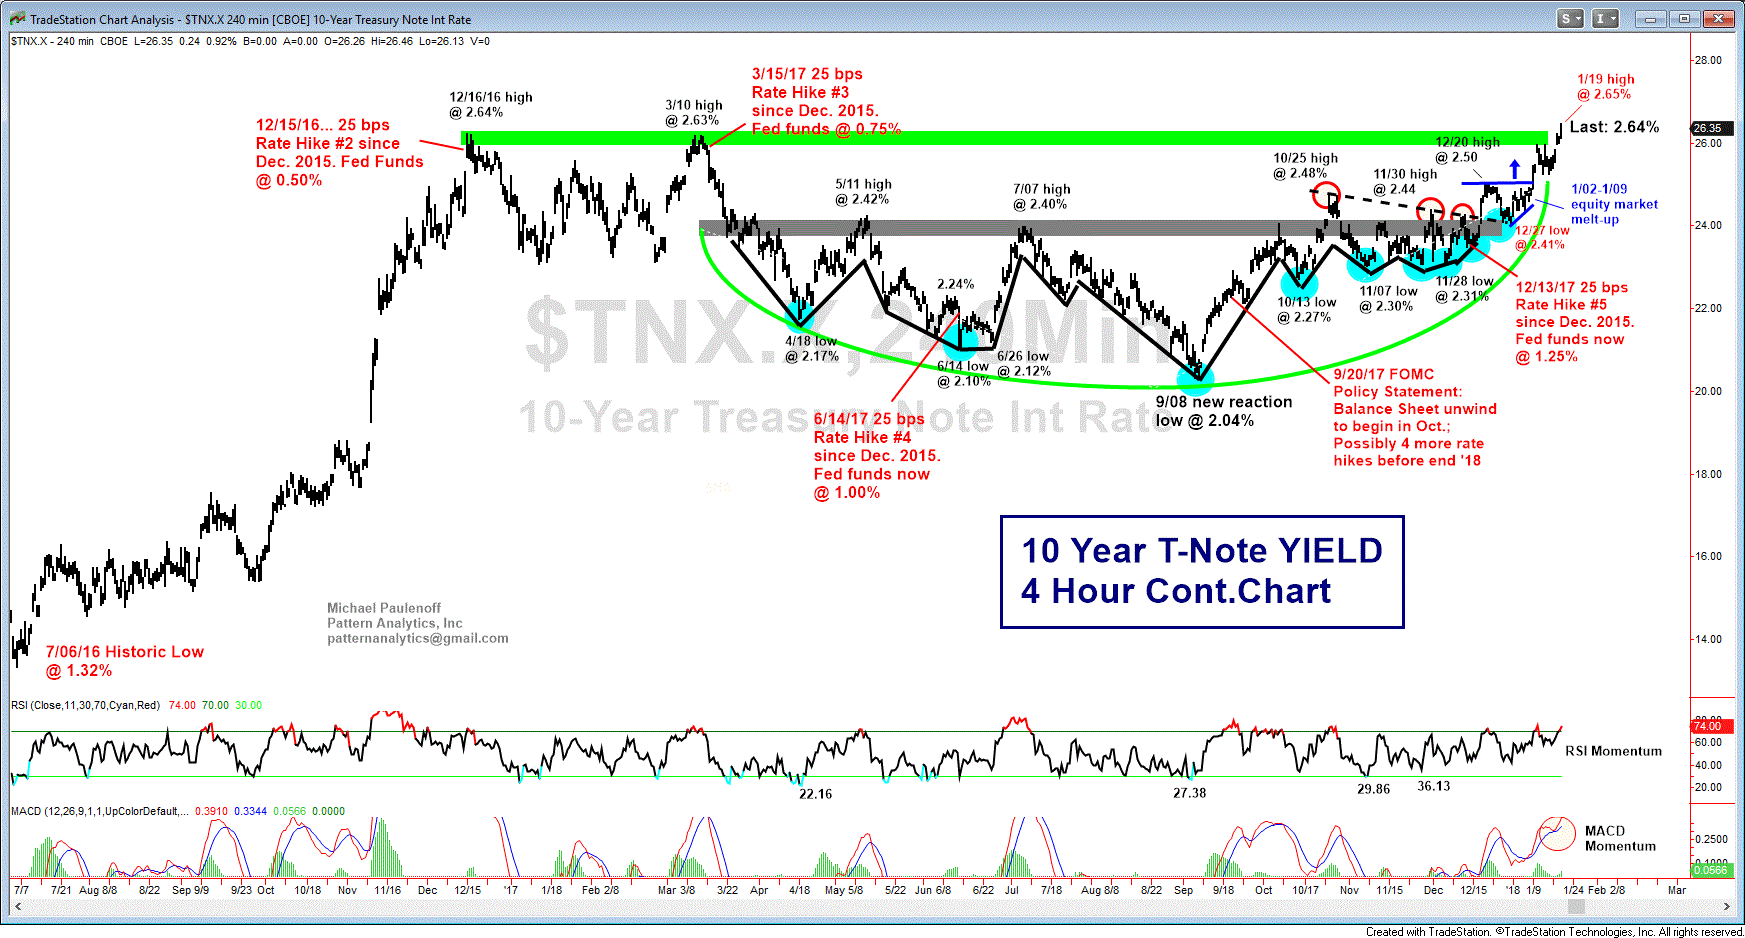
Earlier today, 10 year YIELD hit a high of 2.65% (now is trading at 2.64%), which we see on the enclosed chart (from the July 2016 low at 1.32%), is above EVERY prior YIELD high during 2016 and 2017, and in fact is above every YIELD high back to 2.69% in July 2014!
In my technical world, that means something, and In my charting world, the enormous 10 month rounded "accumulation pattern" during 2017 is significant as YIELD breaks out to the upside that projects continuation to a 3.25% - 3.35% next target zone.
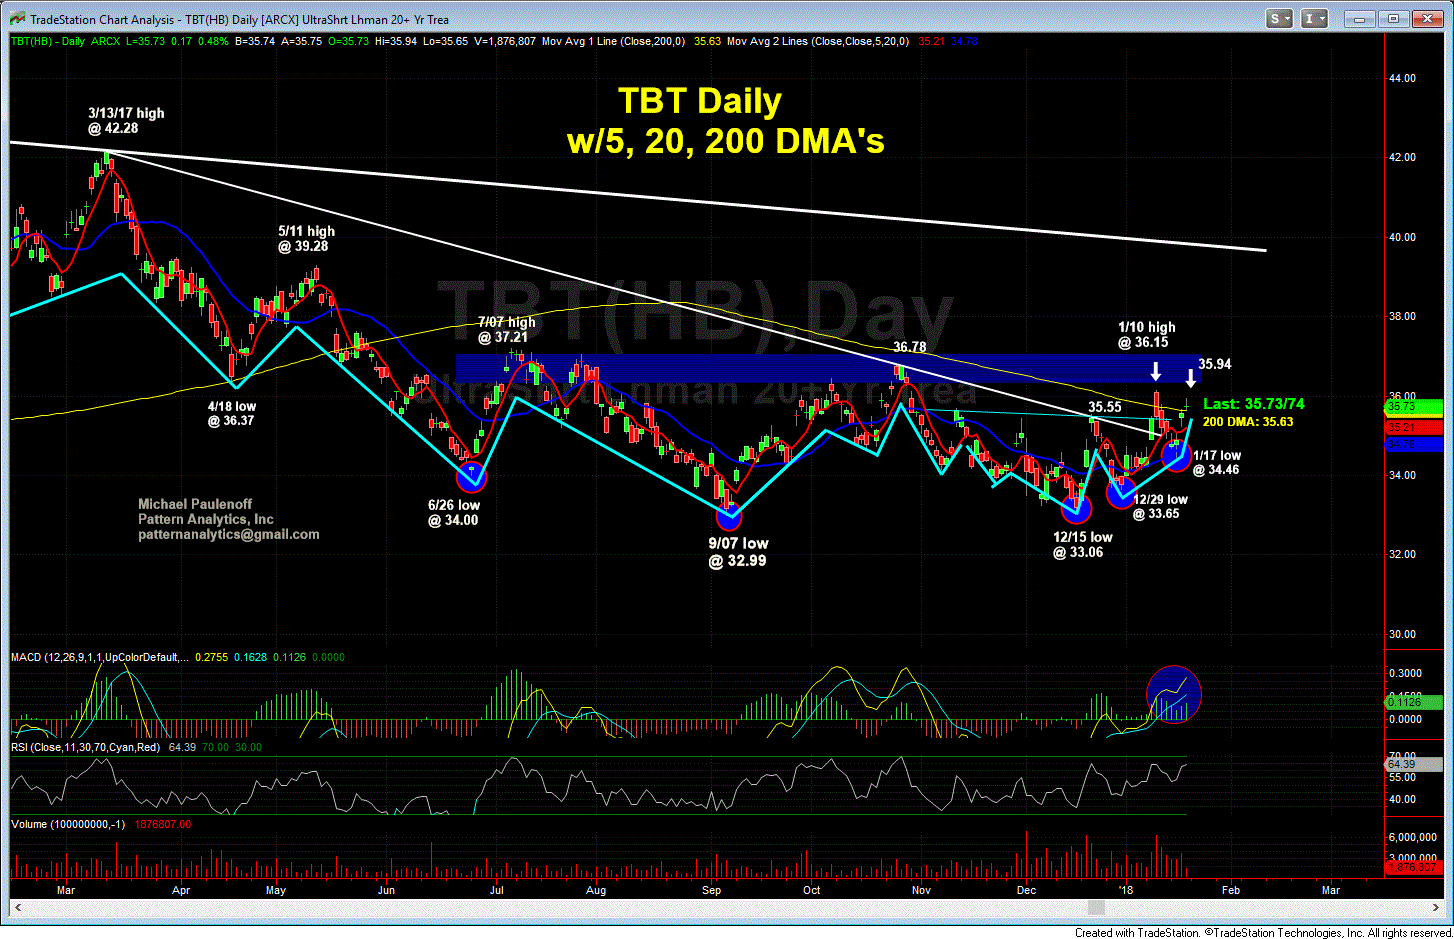
Also enclosed is my daily chart of the TBT, which shows that the price structure is trading above its flattening 200 DMA (35.63) for just the second time since May 2017. A CLOSE above the 200 DMA will be the first time TBT has done so since May 23rd 2017.
I guess the potential for a run well above 3% in the upcoming days and weeks could be ignored by the equity markets, as investors sell bonds and shift money into stocks, propelling the equity indices even higher. Something tells me though, to keep an eye on the US Dollar, because if for some reason it is unable to lift at all amid long rates backing up, then it may well be weakness in the Greenback itself that will drive rates higher, threatening to undermine the goldilocks world of the never-ending equity market advance.
Just thinking out loud, based on how my Big Picture macro charts appear to be setting up these days. MJP