Yield & TBT Charts Show No Flight to Safety
Based on the price action of Crude Oil (lower), 10 year YIELD (TBT), and Gold, we could think that whatever POTUS intends to do today will NOT be disruptive, and will not escalate tensions, especially in the Mid-East. Indeed, perhaps a kindly, gentler Trump will emerge this afternoon, and either will provide the Iranians with a face-saving out, or announce some new provision that the Iranians have agreed to that the markets already are sniffing. While I think that is a long shot, the markets know much more than I do.
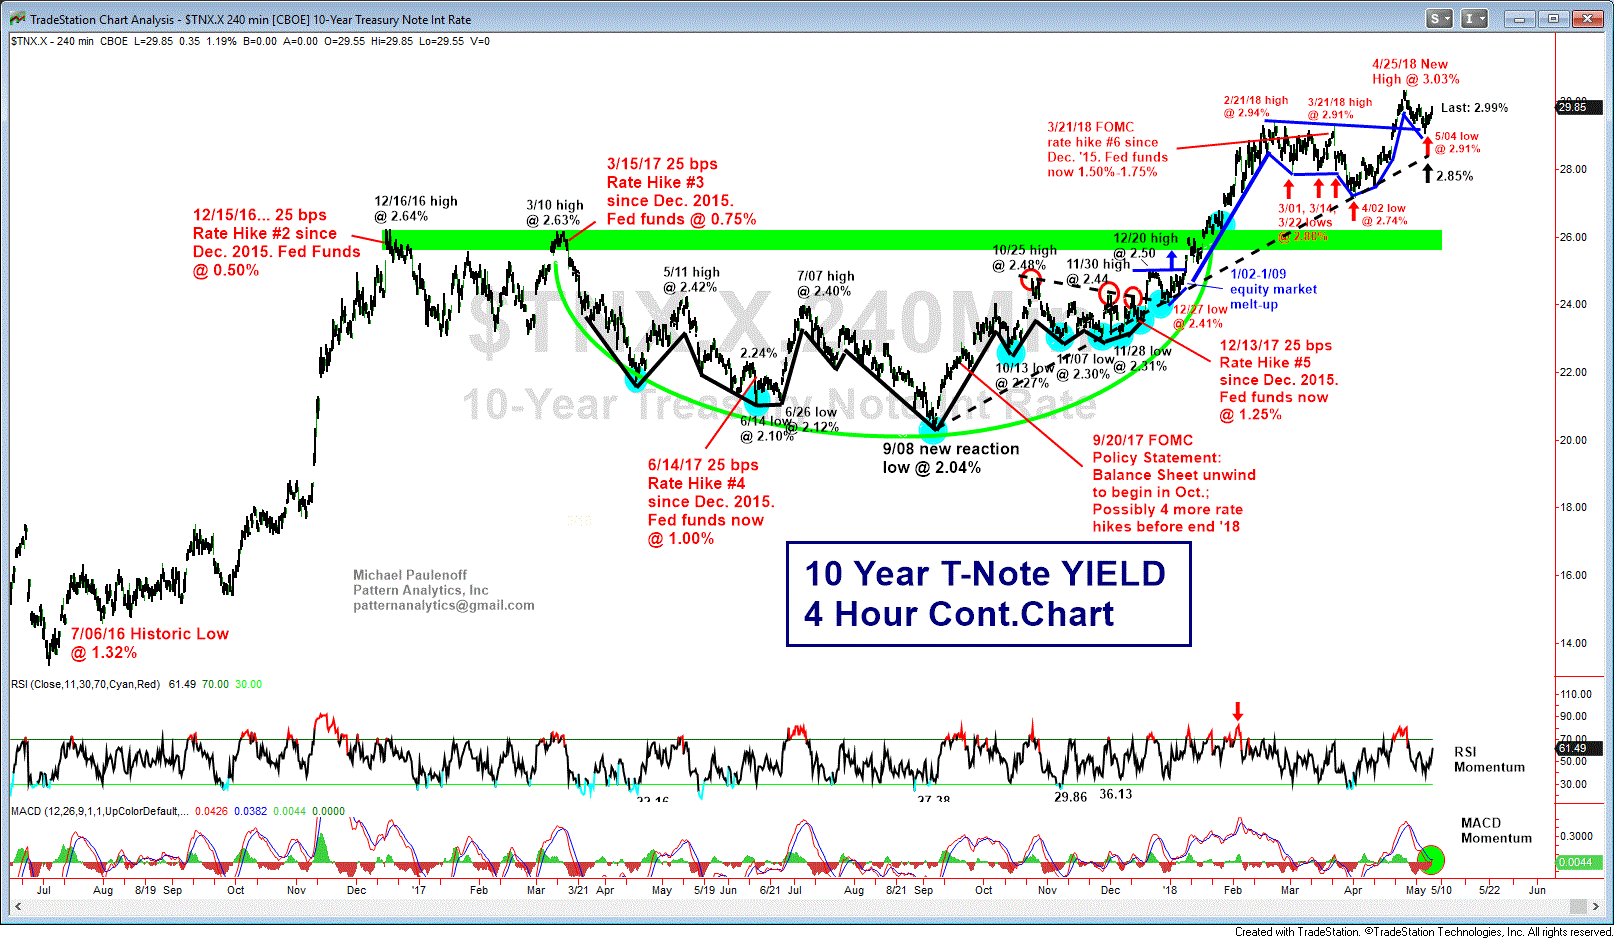
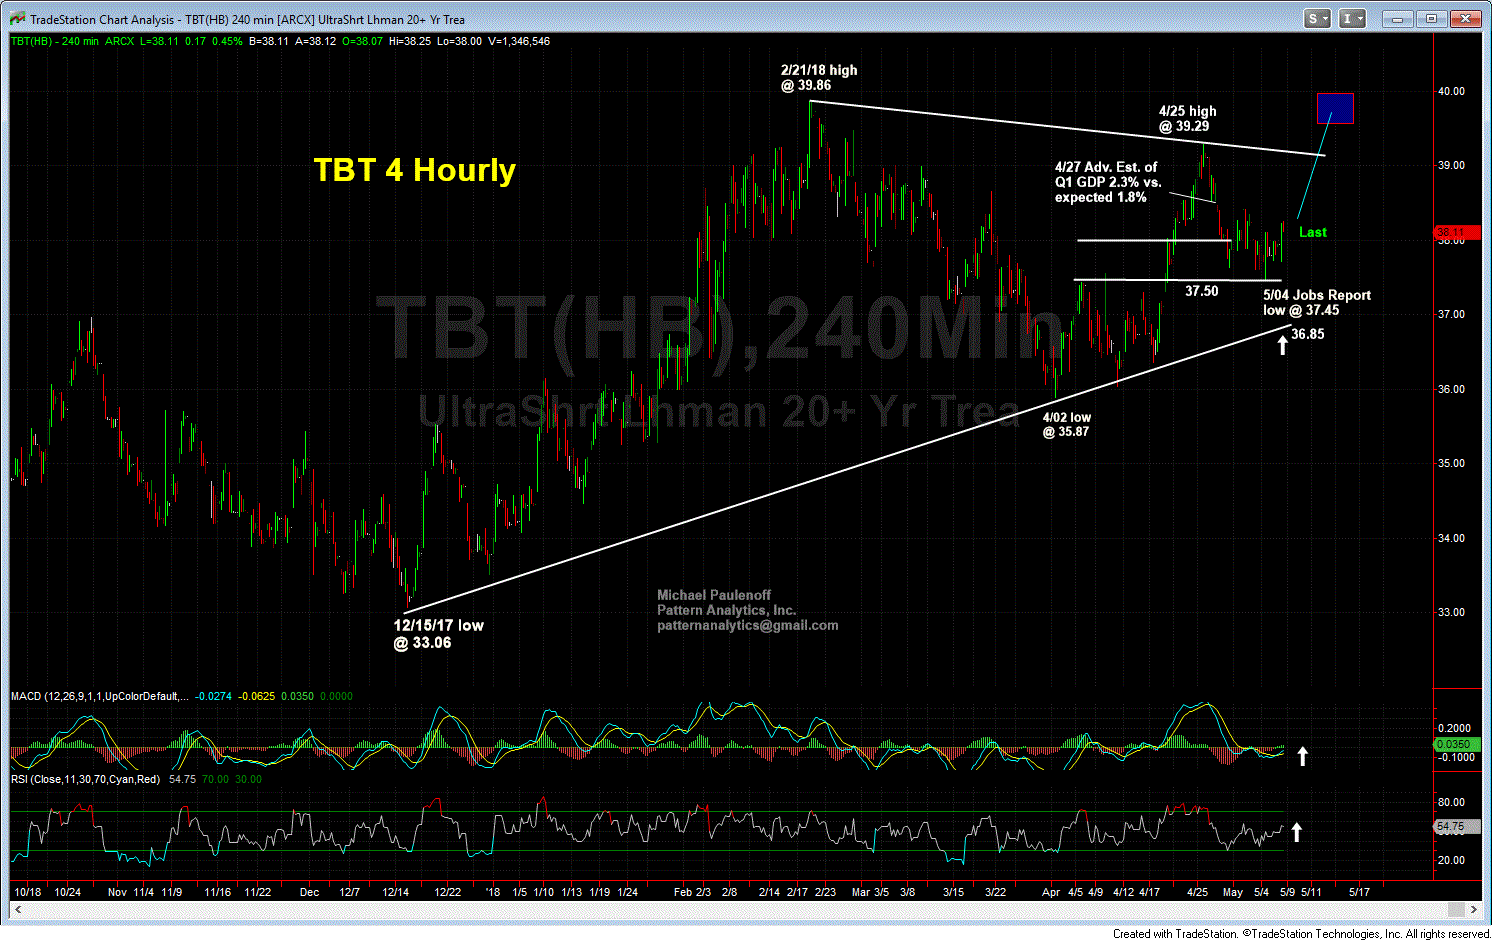
The attached YIELD and TBT charts show upward pressure on YIELD (higher prices for TBTs) as the 2 PM ET announcement approaches, suggesting there is NO flight to safety. In fact, just the opposite is the case-- a continued sale of US Treasury securities, which could be a function of this week's auctions, but nevertheless, is interesting ahead of a potentially destabilizing geopolitical decision.
Purely from a technical perspective, 10 year YIELD again is pushing up against 3%, even after the recent relatively weak Jobs Report. My sense is that the pressure either is a function of the prospect of much more supply hitting the market in the upcoming months, latent inflationary forces, or a hit to confidence in the efficacy of the US Government. Perhaps the buoyancy of YIELD is a combination of all three?


