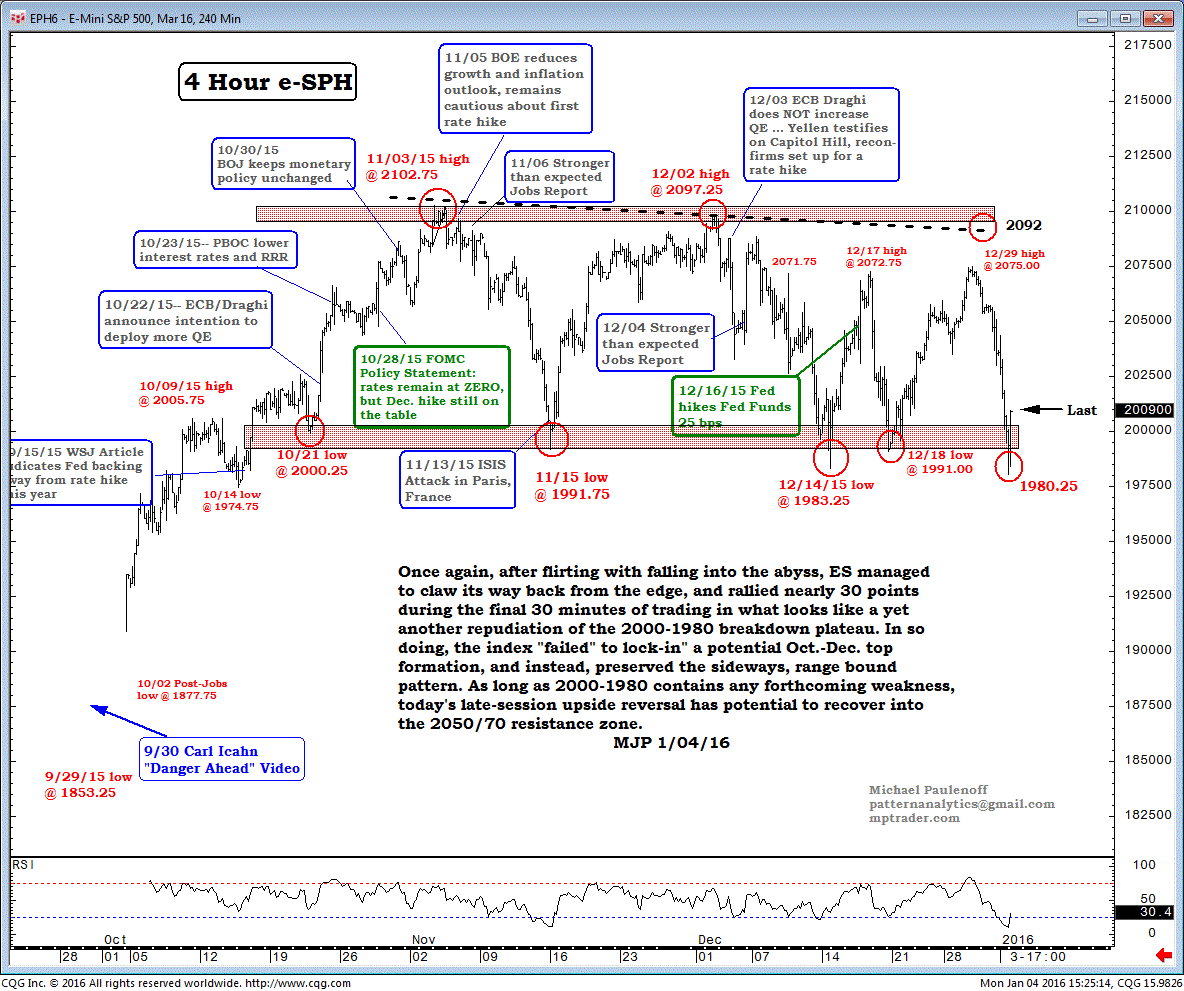
Chart on Emini S&P 500
Once again, after flirting with falling into the abyss, the Emini S&P 500 (ES) managed to claw its way back from the edge and rallied nearly 30 points during the final 30 minutes of trading in what looks like yet another repudiation of the 2000-1980 breakdown plateau.
In so doing, the index "failed" to lock in a potential Oct-Dec top formation and instead preserved the sideways range-bound pattern.
As long as 2000-1980 contains any forthcoming weakness, Monday's late-session upside reversal has potential to recovery into the 2050/70 resistance zone.

