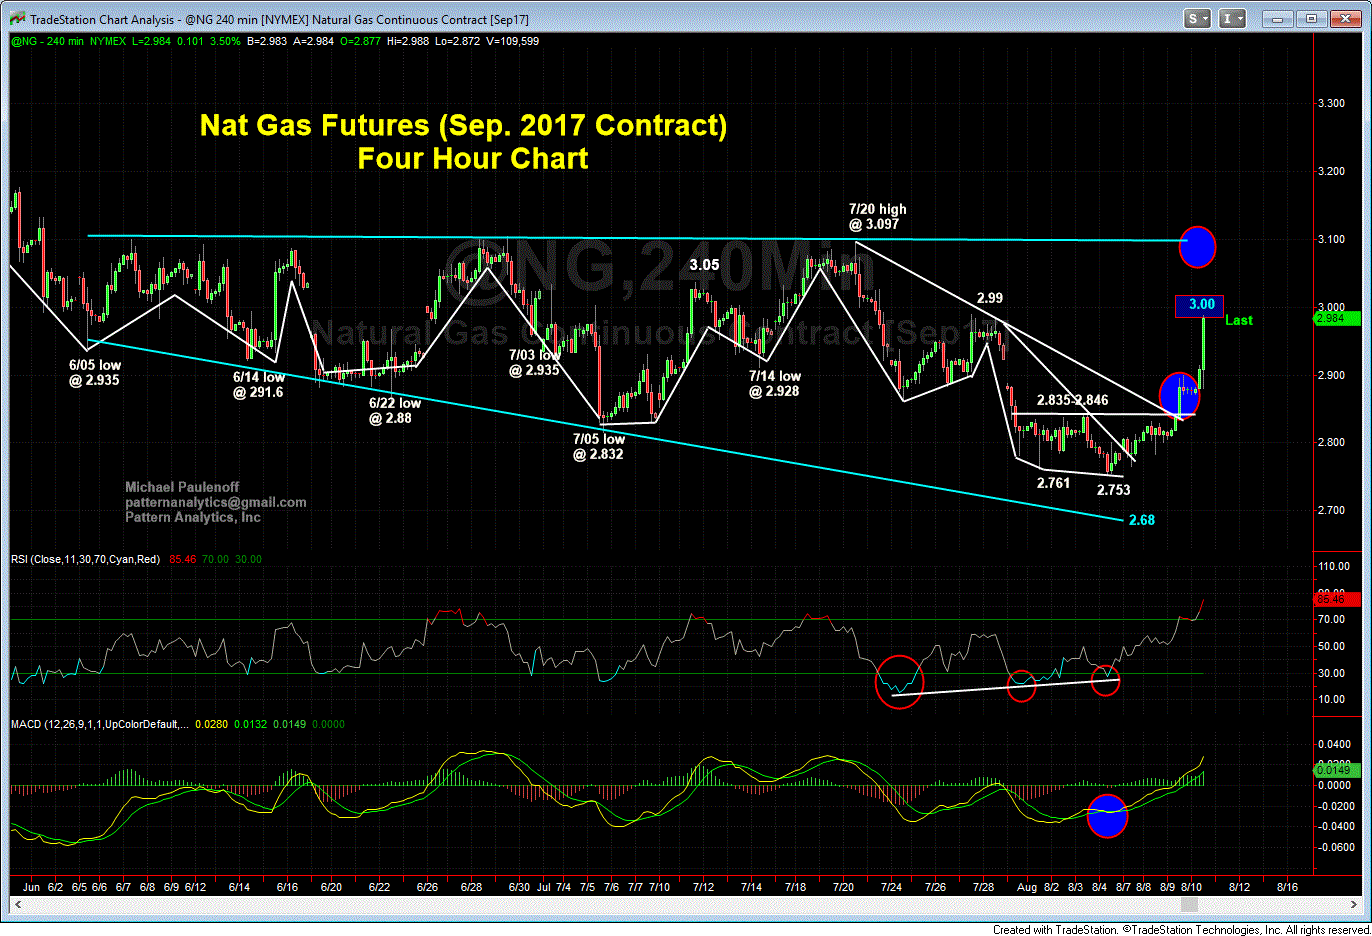
Charts on Nat Gas Futures

The first chart (from Aug 8) shows the positive juxtaposition of our nearer-term momentum gauges with the sideways price action -- one of the indicators we used in anticipating the upmove.  The second chart (from Aug 10) shows the breakout and our target going forward.


  Matched
x
  • Action-Oriented Trade Set-Ups in Stocks & ETFs
  • Macro Analysis of the Broader Markets
  • Detailed Technical Guidance for each Trading Idea
  • Live Interaction w/ Mike & Our Member Community
  • And Much, Much More!
Join Now! - Special Offer!
Veteran Wall Street analyst and financial author, Mike provides detailed and timely analysis and trade set-ups on a range of markets. Read more...

Have Mike's “Out Front” morning analysis delivered FREE to your email inbox twice weekly!