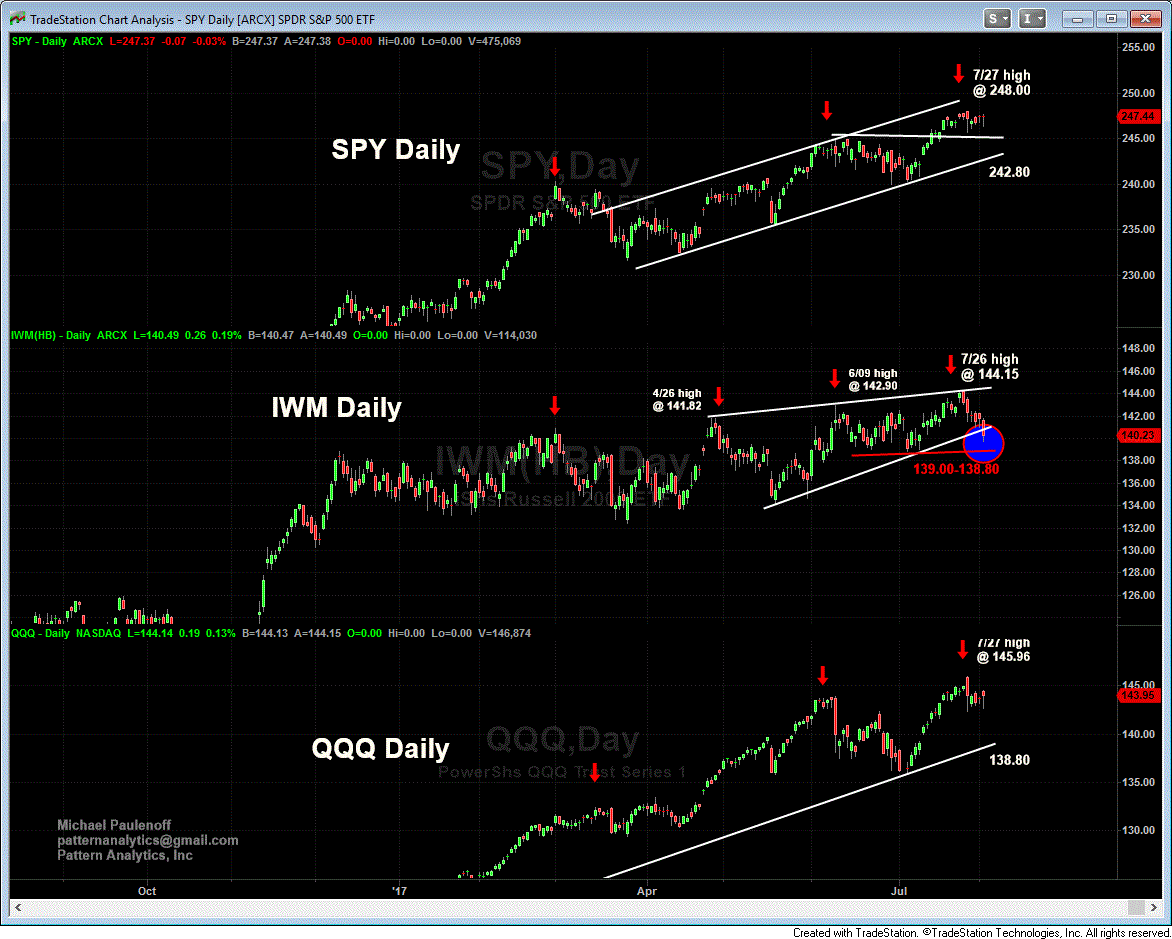
Charts on SPY, IWM & QQQ

All three of the indices exhibit a series of higher-highs and higher-lows.  However, IWM has deteriorated of late, and has pierced its June-August up trendline, which has made it vulnerable to a breakdown -- especially if IWM breaks and sustains beneath key support at 139.00-138.90. Such a sustained break of support in IWM will leave behind a very toppy, threatening, two month price pattern.

  Matched
x
  • Action-Oriented Trade Set-Ups in Stocks & ETFs
  • Macro Analysis of the Broader Markets
  • Detailed Technical Guidance for each Trading Idea
  • Live Interaction w/ Mike & Our Member Community
  • And Much, Much More!
Join Now! - Special Offer!
Veteran Wall Street analyst and financial author, Mike provides detailed and timely analysis and trade set-ups on a range of markets. Read more...

Have Mike's “Out Front” morning analysis delivered FREE to your email inbox twice weekly!