Fib Resistance Warns to Err on Side of Caution
The S&P 500 (SPX) is right at a price zone pointing towards a meaningful give-back in the short-term.
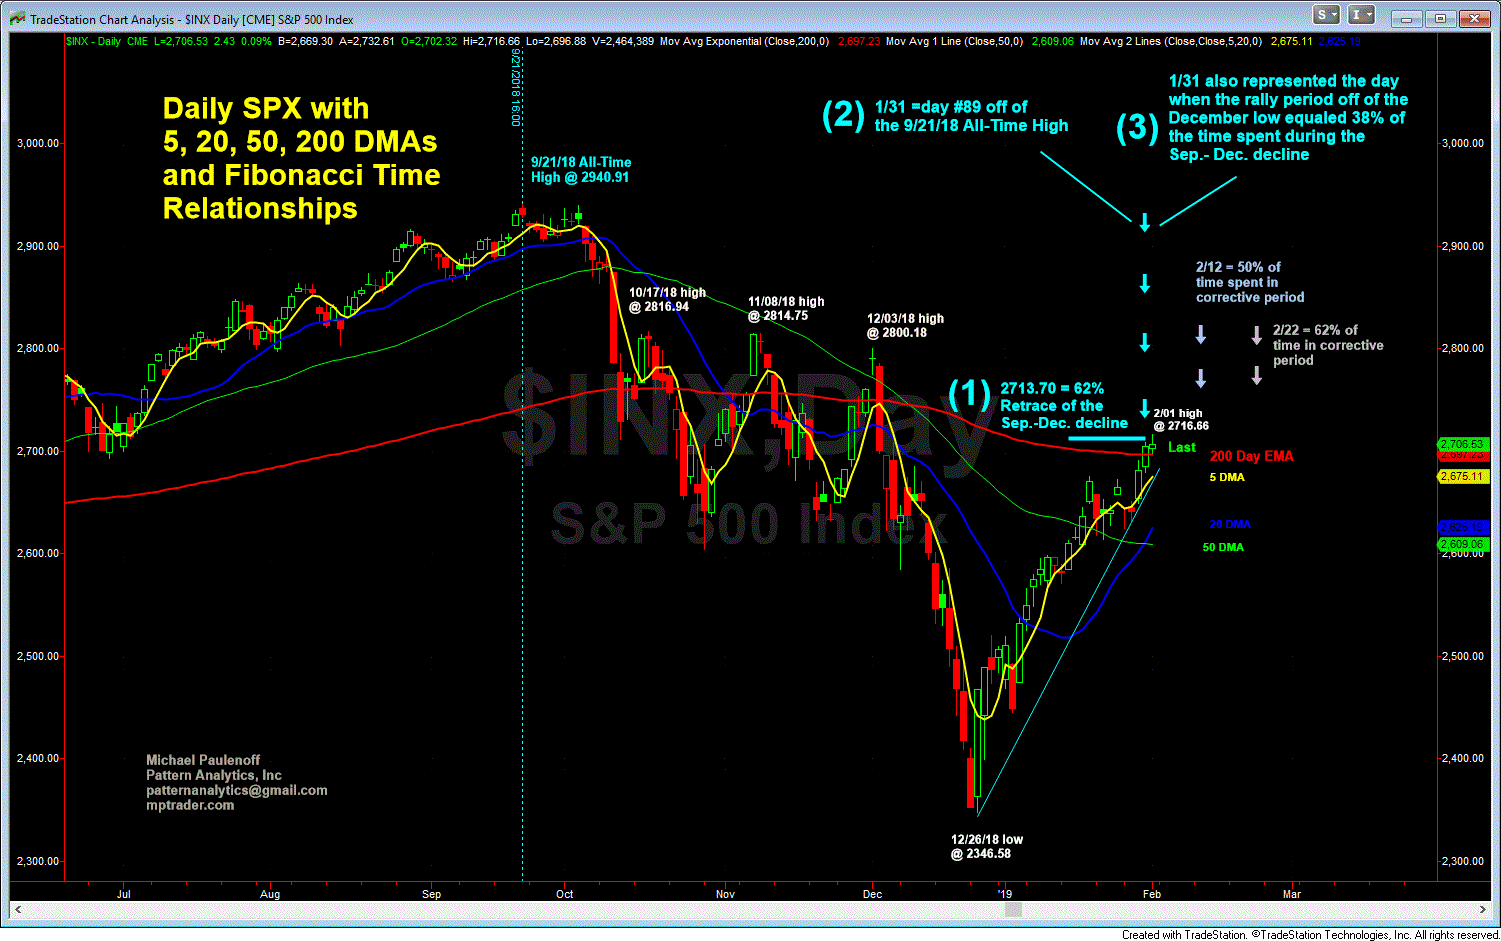
This zone of resistance can be viewed through the Fibonacci price and time relationships on the daily SPX chart.
As the chart shows, as of Friday's close, the SPX resided approximately 16% above its late December lows, amounting to an exact 62% Fibonacci recovery of the entire prior decline from the Sep 21 all-time-high at 2940.91 to the Dec 26 low at 2346.58.
In addition, last Thursday Jan 31, the SPX made its closing recovery rally high at 2704.10, which represented the (Fibonacci) 89th trading day since the establishment of the Sep 21 all-time high.
Finally, Jan 31 also represented the day when the recovery rally period from Dec 26 to Jan 31 equaled a Fibonacci 38% of the duration of the Sep- Dec decline period.
Purely from a technical perspective, unless Fibonacci recovery time and price converging around 2715 are purely coincidental, my sense is that SPX is circling a critical and consequential price zone that EITHER will conclude the post-December recovery period ahead of some magnitude of correction OR represent a launchpad for upside acceleration and continuation quickly towards 2800-2820.
As I see current conditions, given the presence of the Fibonacci relationships, there is no gray area separating the two scenarios. It is significant correction versus sharp upside continuation.
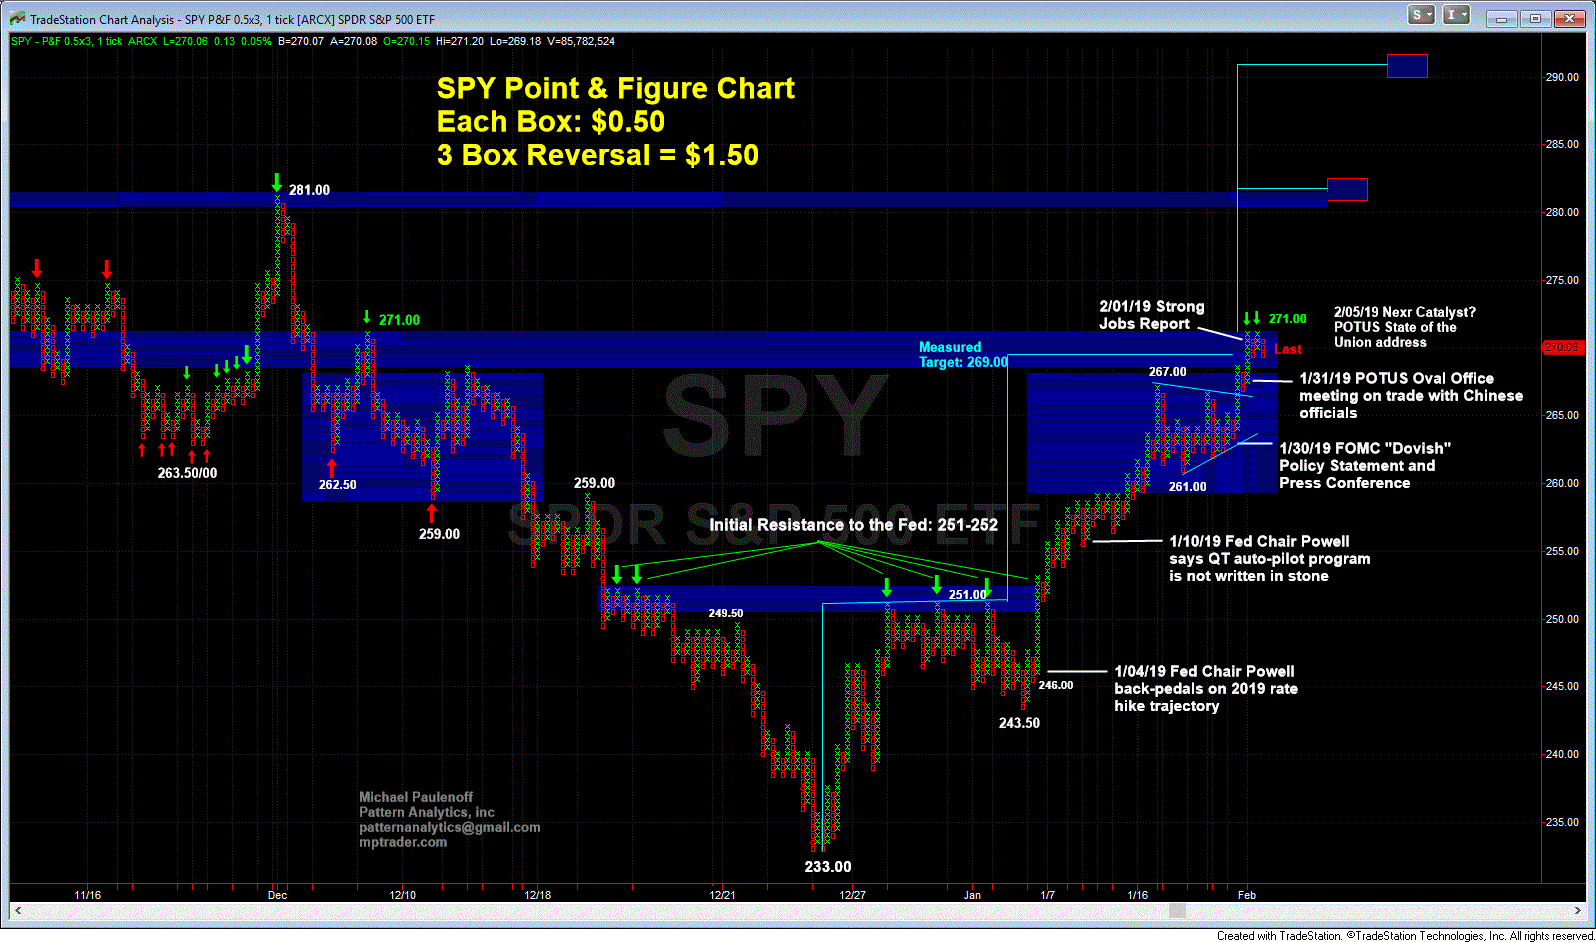
From an alternative perspective, let's look at the SPY Point & Figure chart set-up, which shows that the action since mid-December can be viewed as a large, potentially explosive accumulation pattern that is testing important resistance at 271, or the equivalent of 2710 in the cash SPX. If SPY climbs to a new recovery high print at 271.50, it will "break out" of its big base formation, triggering upside potential that projects to targets of 281, 292, and 300!
Before everyone gets all bulled up, let's notice that the SPY Point and Figure price action ended last week with a minor sell-off from 271 to 269.50 that initiated a down-column of Red O's heading into Monday's open. If SPY opens lower on Monday, and prints 269.00, the column of Red O's will gain more downside traction towards testing 267 prior, the prior upside breakout zone that coincided with President Trump's meeting with the high-level Chinese officials in the Oval Office last Thursday afternoon.
At the moment, the confluence of the Fibonacci price and time relationships shown on the cash SPX chart, heavy resistance at the neckline 271.00-271.50 zone on the SPY Point and Figure chart, and four weeks of extremely supportive and influential market catalysts (intervention by the Fed, promising China trade updates, and a strong January Jobs Report), suggest strongly to me that a pause in, if not a meaningful give-back of the advance approaching in the upcoming hours.
This Tuesday evening's (9 PM ET) State of the Union address from President Trump is setting up to be another influential extraneous price catalyst for the equity markets that has potential to trigger the next directional algo-spike in one direction or other. That said, Fibonacci resistance is warning traders to err on the side of caution.


