Market Analysis for Feb 24th, 2019
With the equity indices up over 20% in 9 weeks, and now that a majority of investors are feeling much more comfortable and confident, we have to be even more mindful of an approaching reaction in the days immediately ahead.
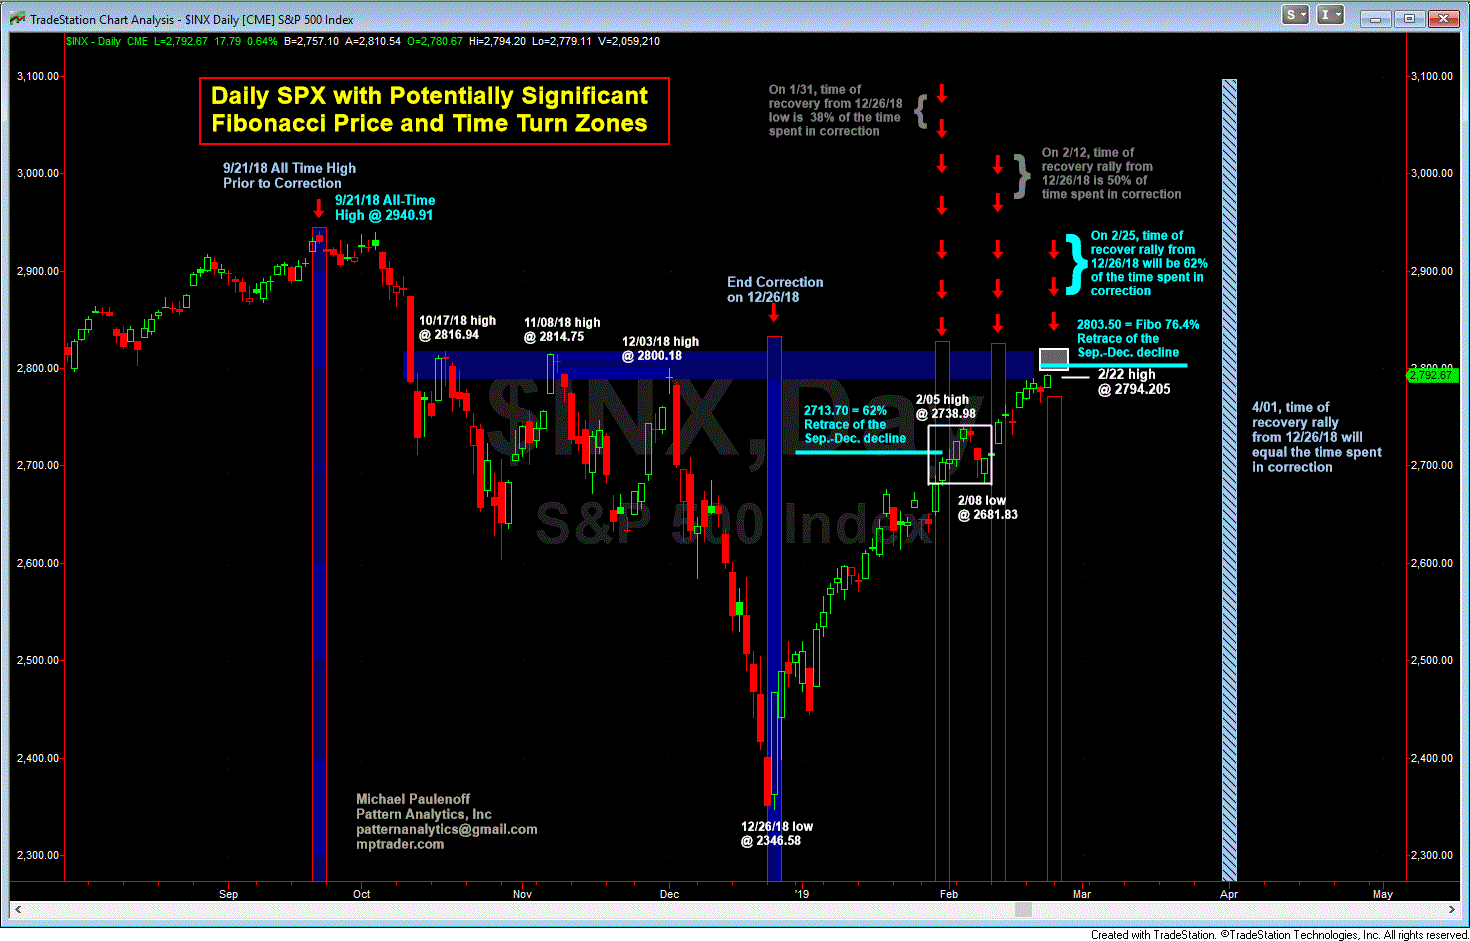
Technically, our focus will be on another potentially important Fibonacci Price and Time intersection on the S&P 500 chart. The previous significant intersection occurred from Jan 31 into Feb 11, which we discussed in previous articles.
During that 8 trading day period, the SPX probed and circled the 62% recovery retracement area -- at 2714 (+/- 1%) -- of the entire prior corrective decline from the Sep 21 high at 2940.91 to the Dec 26 low at 2346.58. Furthermore, the time spent in the recovery rally period equaled 38% of the time SPX spent in the September-December correction.
From my perspective, the intersection of the 62% price and 38% time recovery levels at 2714 (+/- 1%) presented and represented a potentially significant “natural” headwind to continued upside -- i.e., continuation of the powerful, Fed-induced, return-to-easy-money, near-vertical advance of the index. This is not to say that these "natural barriers" had to or should reverse SPX direction, only that traders and investors needed to be aware of the higher probability for an SPX reversal than would otherwise be expected in the absence of these Fibonacci relationships.
However, after spending 8 trading sessions between 2681.83 and 2738.98 from Jan 31 through Feb 11, the SPX surged to the upside into a new upleg that left the 62% Price and 38% Time resistance zone in the rear-view mirror.
The resumption of price strength was a warning signal to doubters of the recovery rally that other forces are still at work that are more powerful than the confluence of Fibonacci relationships during the first week of February.
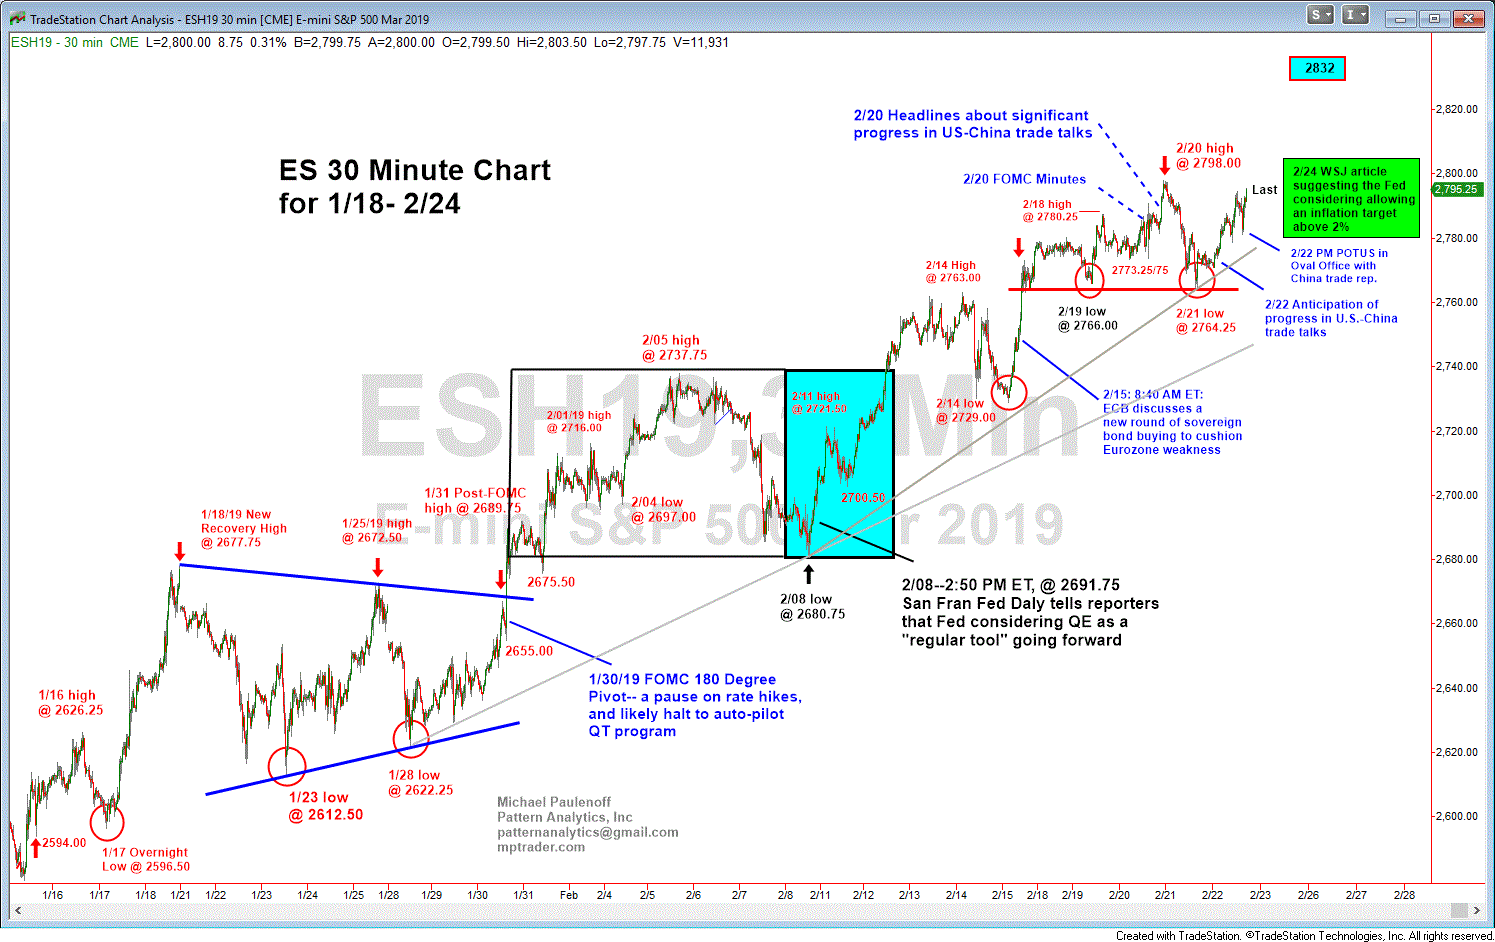
More important or dominant than the intersection of Fibonacci price and time resistance was continued sensitivity and responsiveness of the index to any and every positive headline about either renewed (coordinated) central bank easy money interest rate policy, and progress in the US-China trade talks. Indeed, during the afternoon of Feb 8, with the SPX still in the Fibonacci time and price window (2714 +/- 1%), and pressing on the low side of the window, San Francisco Fed Head Daly revealed to reporters that the Fed is considering instituting Quantitative Easing as a “regular tool” to use in the event that “adjustment” in the level of Fed funds proves insufficient to stimulate the economy.
While such a statement could be construed as a cause for concern by some investors (myself included), the reaction of the market— an immediate upside price thrust -- certainly suggests otherwise. An accompanying chart of the March e-Mini S&P Futures Contract (ES) shows the coincident timing of San Francisco Fed Daly’s disclosure on Feb 8 of a policy that was originally developed to be an “emergency program by then Chairman Ben Bernanke,” but going forward, likely will become a routine procedural option for the Fed.
The ES wasted no time in rocketing to the upside in the aftermath of that headline, triggering computer buy programs designed to sweep for positive Fed news. As it turned out, the headline coincided with the initiation of a new upleg that took just 2 sessions to rip from the lower bound of my Fibonacci time and price zone (2681) through its upper boundary (2740).
While the stunning FOMC (Powell) reversal on interest rate policy and newfound “sensitivity” to the message of the equity markets on Jan 30 propelled ES into the headwinds of my next Fibonacci price and time zone (2714 +/- 1%), it was the follow-up news on Feb 8 about “normalization of QE” that invalidated Fibonacci resistance.
Fast-forward to today, there is a new potentially consequential Fibonacci Price and Time Resistance Zone.
With respect to Time, on Monday Feb 25, the rally from the Dec 26 low will have equaled 62% of the time spent in the September-December correction.
As for Price, 2803.50 (+/- 1%) is the Fibonacci 76.4% recovery of the entire September-December decline. In terms of Fibonacci percentages, 76.4% is the reciprocal of 23.6%, and while it is nowhere near as important as The Golden Ratio of 62% (hurdled after Feb 8), it is nonetheless the next higher Fibonacci retracement zone (2803.50 to 2832) that could present problems for this historic 9-week advance. For this reason, it is on my radar screen starting tomorrow.
In that the early February intersection of Fibonacci Price and Time (Jan 3 and 2714/40) succumbed to heat seeking algo (central bank and China trade) news scanners, we should be mindful of this week’s upcoming headline triggers that will have the potential either to rip the indices up through 2803.50-2832, or conversely, fail to produce a bullish reaction in the 10th week of the advance, which despite the positive news, will argue that the upmove is at or nearing exhaustion:
- Feb. 25: Fed Vice Chair Richard Clarida speaks in Dallas
- Feb. 26: Powell testifies before Senate Banking Committee
- Feb. 27: Powell speaks before House Financial Services panel
- Feb. 28: Clarida speaks in Washington; Atlanta Fed’s Raphael Bostic speaks at banking conference; Philadelphia Fed’s Patrick Harker speaks on economic outlook; Dallas Fed’s Robert Kaplan speaks in San Antonio; Cleveland Fed’s Loretta Mester speaks in St. Louis; Powell speaks at a conference in New York
- March 1: Bostic speaks at economic policy conference
(Courtesy of Barron's)
In that the equity markets have been hypersensitive to Fed headlines, Tuesday AM’s testimony by Fed Chairman Powell before the Senate Banking Committee will be fraught with potential market volatility, as each of his statement’s become triggers for the algo programs. Will he toe the line of “pause, patience, and data dependency,” sending the indices to the upside above 2803.50 towards the top of the Fibonacci Price and Time zone? Or will he create a sliver of doubt about how long the Fed is likely to remain in “pause mode,” especially if the Fed intends to raise its inflation target? Should Powell waver slightly, atop a 22%, 9 week advance, headlines could trigger weakness that fortify the Fibonacci Time and Price resistance zone on Feb 25 at 2803.50-2832.00.
While the Fed Heads are pontificating Monday through Wednesday, President Trump will be in Vietnam for his second summit with Kim Jong-un next Wednesday and Thursday, a period that certainly will be peppered by presumably positive headlines. Overlay the Vietnam Summit with headlines about progress (or lack of progress) in the ongoing U.S.-China trade deal, and investors could find that the market’s focus has shifted to foreign and trade policy from consistency of the interest rate message from the Powell Fed.
Finally, as if we won’t have enough headline uncertainty next week, we can’t rule out a possible market reaction to the Michael Cohen hearings on Capitol Hill on Wednesday morning, which if nothing else, could provide some inkling about what Special Council Robert Mueller might report in early March.
Indeed, next week could be wild. For our purposes, let’s see how price action behaves in and around my Fibonacci Price and Time Intersection of Feb 25 and 2803.50/32. It is the next critical resistance zone and timeframe that could impede upside progress, or alternatively, give way to yet another vertical run towards a test of the all-time high.


