Oil Bulls Taking A Breather
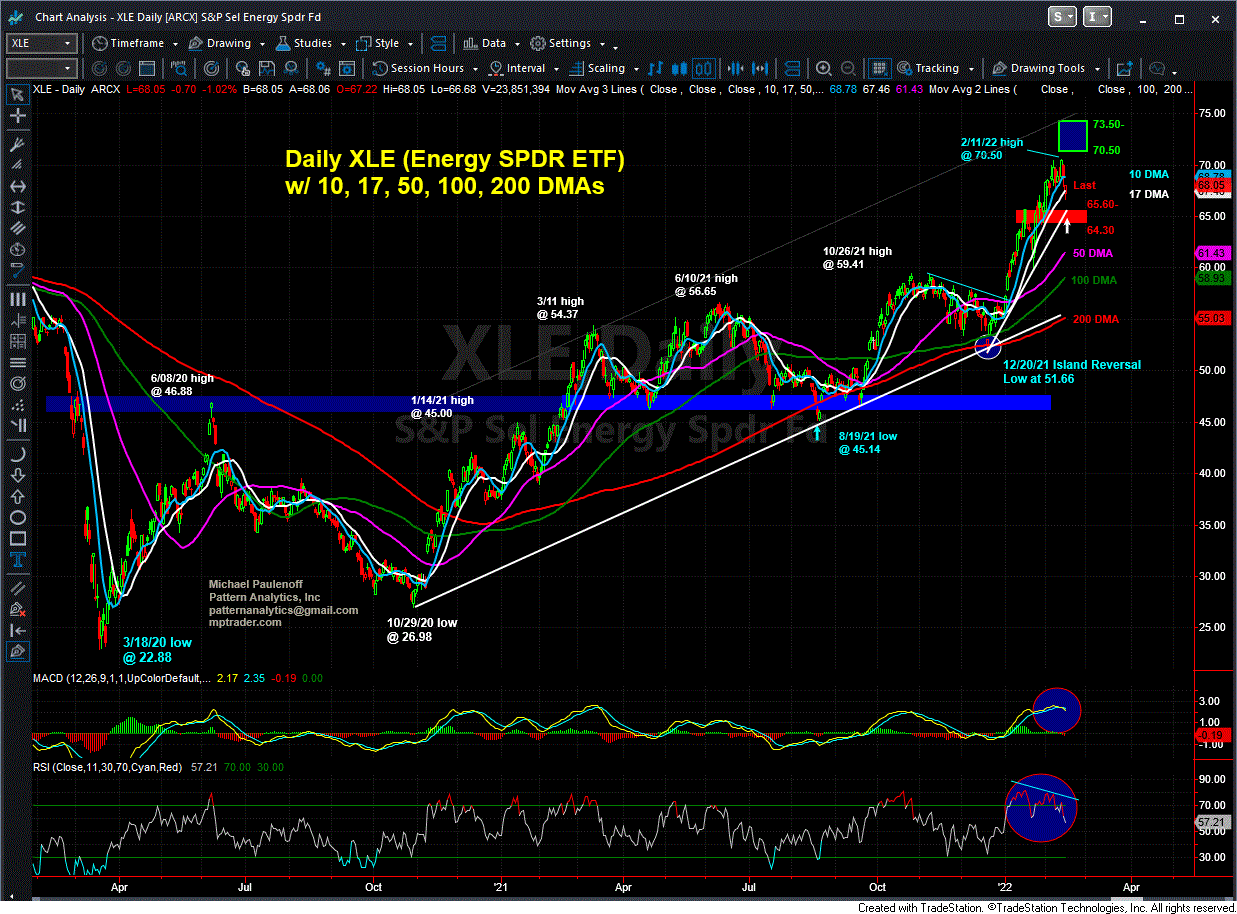
Last Friday (2/11/22), XLE hit a high at 70.50, the highest price for this Energy Sector ETF since October 2018.
That said, however, we can see on my attached Daily Chart that last Friday's high was NOT CONFIRMED by my Daily Momentum Gauge (RSI), and as such, triggered a warning signal that holders of long position should be on alert (and raise protective stops) in case XLE rolls over into a full-fledged correction after a 56% advance since its August 2021 pivot from 45.14.
Purely from a technical perspective (putting aside geopolitical whipsaws for the moment), my work indicates that the current pullback is tolerable unless and until XLE breaks and closes beneath support lodged from 65.60 down to 64.30.
A bout of weakness that preserves support at 64.30-65.60 keeps intact that bullish structure of the post-Dec. 2021 upleg (from the 51.66 Island Reversal Low), which still has a valid upside projection above 70.50 towards 73.00-75.00 next.
Conversely, a decline that breaks 64.30 however, will leave XLE vulnerable to downside continuation into the 60 to 58 target support zone. I can only imagine that such a weak scenario will reflect the reversal of geopolitical risk premium in the Oil market, perhaps coupled with an inversion in the Yield Curve that argues for the onset of a recession in the upcoming months. For now, though, the Oil bulls remain in directional control but are taking a brief breather... Last is 67.72

