Alerting About NVDA's Upside Ahead of +45% Rally

by Mike Paulenoff
March 26, 2023 • 10:51 AM EDT
On January 24, we alerted MPTrader members to an opportunistic technical setup in NVDA, writing:
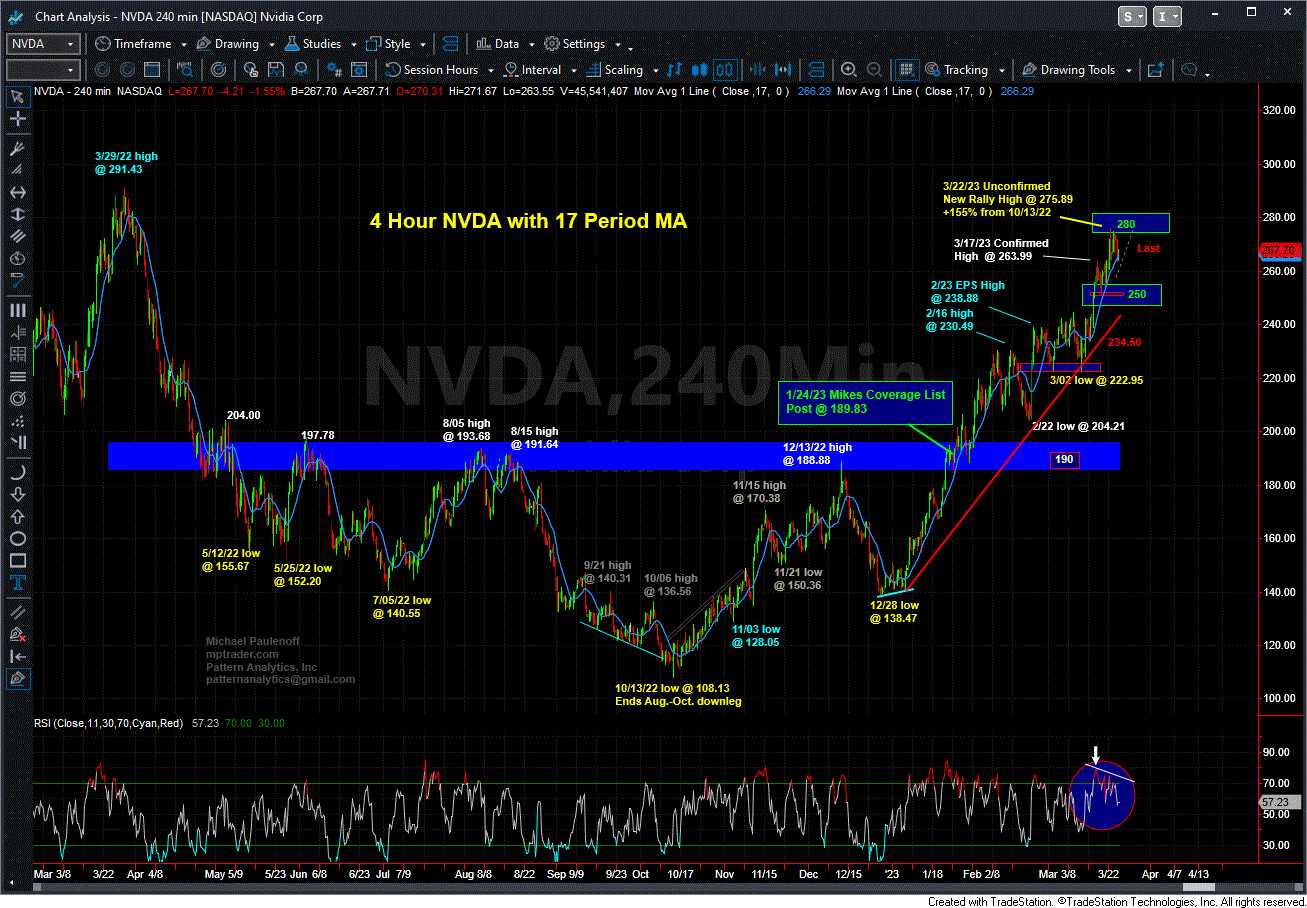
"NVDA Bottom Line: When I zoom out for a view of all of the price action for the past 8 months, I can make a compelling case that a very powerful base-accumulation period and pattern have developed that is putting intense upward pressure on the 198-200 multi-month resistance-upside breakout zone that if hurdled, will trigger an intermediate-term projection to at least 218-224, and an outlier upside target zone closer to 280. As long as any forthcoming weakness is contained by support lodged from 178 down to 167.30, NVDA deserves the benefit of the doubt on the upside for the next 1 to 3 months... Last is 189.83."
Fast-forward 8 weeks to last week's trading where NVDA hit a high of 275.89, up 155% from its October 2022 major corrective low at 108.13, and up 45% from where it was trading when we initially alerted MPTrader members!
What's next for NVDA? As much as I would like to tell members that NVDA still has much higher to climb, my current read on the technical and fundamental situation indicates that in the nearer-term timeframe, NVDA is showing signs of technical stress that I usually associate with approaching upside exhaustion ahead of a meaningful pullback.
In addition, NVDA recently has been the recipient of a lot of positive press and Wall Street hype about its central chip design and production position uniquely suited to supply the forthcoming explosion in Artificial Intelligence (AI) applications. That said, based on our current setup work, while NVDA is a long-term "hold," we are very cautious near term and look for a substantial bout of profit-taking weakness (20% plus) before another sustained up-leg is likely to emerge.
Join me and our MPTrader member community today to participate in our ongoing intraday discussions about NVDA, and other AI-focused names such as MSFT, GOOG, and ADBE, as well as discussions about the technical and fundamental setups in individual stocks, ETFs, Macro Indices, Commodities, Precious Metals, and Bitcoin.
Mike Paulenoff is the author of MPTrader.com, a real-time diary of his technical analysis & trade alerts
on
ETFs for precious metals, energy, currencies, and an array of equity indices and sectors, including
international
markets, plus key ETF component stocks in sectors like technology, mining, and banking.
Sign up for a Free 7-day Trial!
On January 2, 2026, this is what I posted about CAVA (Cava Group Casual Mediterranean Cuisine) to MPTrader members:After CAVA's meteoric climb from 29.00 in October 2023 to an ATH at 172.65 in November 2024, the stock rolled over into a relentless decline that hit its low at 43.
On the morning of April 9, 2026, this is what I posted about SMR (NuScale Power Corp) to our Discussion Room for MPTrader members:SMR (Nuscale Power Corp)-- Three views of this beleaguered, former high-flying modular nuclear power producer that has been in the grasp of a relentless six-month, 84% bear phase:-- From the perspective of my 4-hour Chart, SMR has the right look of nearing the completion of the downleg that started at the Jan. 2026 recovery rally high of 22.
On the morning of April 7, 2026, this is what I posted for MPTrader members about my interpretation of the near-term technical setup exhibited by META:My preferred technical scenario for META argues that the stock established a significant near-term low at 520.00 on 3/27/26 that resides within an August 2025 to March 2026, incomplete larger corrective process.
Thirty minutes after the opening bell on November 24, 2025, I posted the following heads-up to MPTrader members about the technical setup in META:META has the right technical look of a significant U-Turn to the upside after completing a 27% August-November correction from 796.25 (8/15/25) to 580.32 (11/21/25)... To gain more powerful upside traction, META needs to climb and sustain above nearest-term resistance at 614.70 to 616.50, which if (when) taken out, will open a higher price pathway to the 670 area to challenge the down-sloping 200 DMA... Last is 609.27...
Last Friday morning, to calm frazzled nerves amid a 1% pre-market plunge that was threatening to complete a 100% give back of the prior week's 3.