Anticipating Bitcoin's Recent Rally

by Mike Paulenoff
April 27, 2025 • 10:19 AM EDT
In the early afternoon on April 11, this was my note to our members:
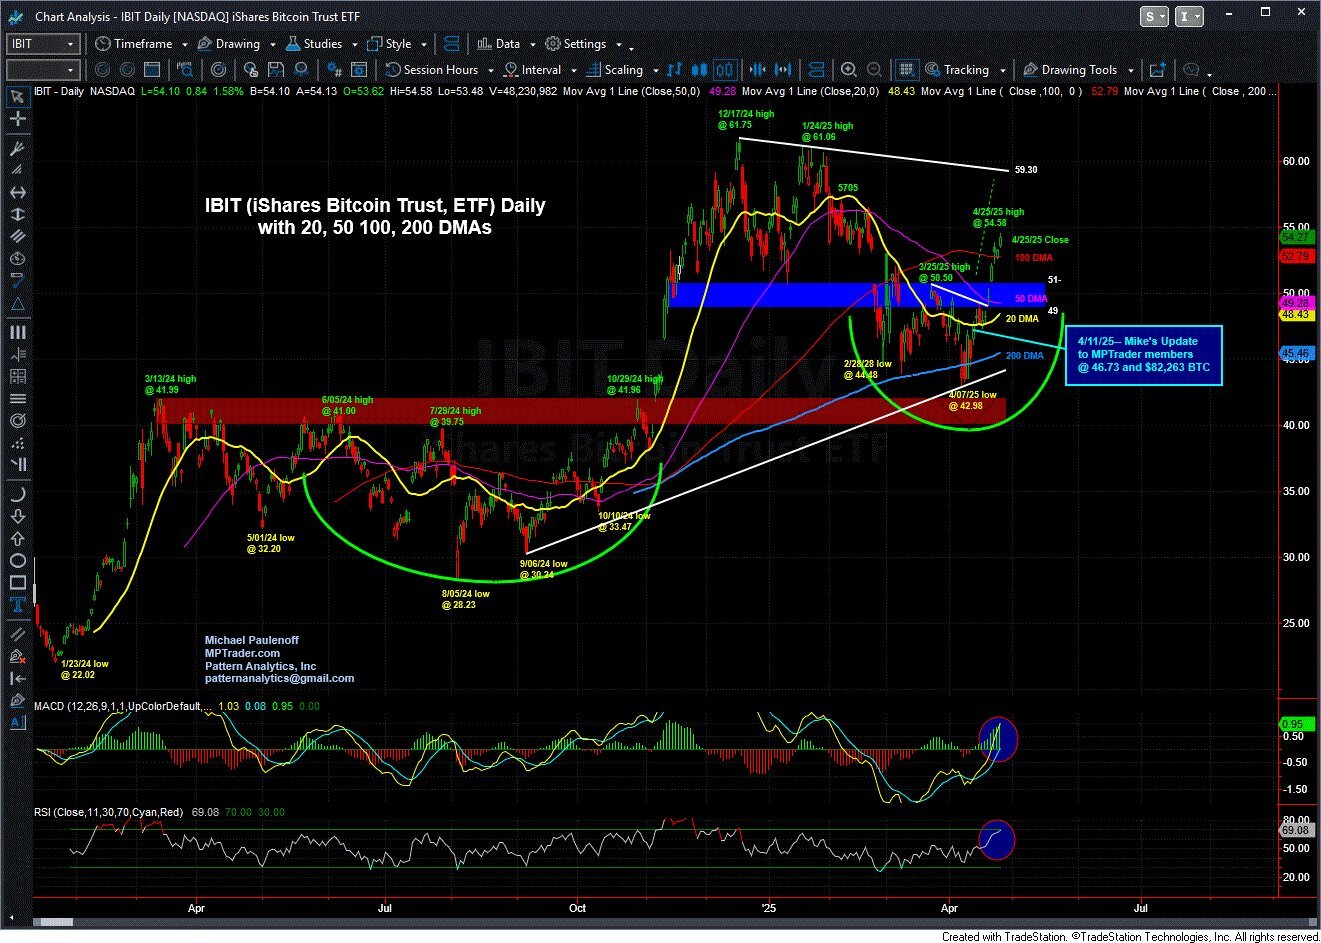
"IBIT (iShares Bitcoin Trust ETF)-- From a trading perspective, anyone who is in sync with the Bitcoin setup might consider owning IBIT (iShares Bitcoin ETF) against a stop below its 4/07/25 low at 42.98 (see my attached Daily Chart below)...The flight out of Treasury bonds and Dollars mostly has redirected capital into Gold, but Bitcoin's relative resilience indicates to me that it is also getting the benefit of inbound capital as well... and if my setup work proves reasonably accurate, will continue to attract inflows in the days directly ahead... Last in IBIT is 46.73... Last in Cash Bitcoin is 82,263..."
During the two weeks-- and multiple follow-up notes-- since I posted the IBIT set-up "heads-up" to our members, BTC has climbed from 82,263 to Thursday's (April 25) high at 95,900 (+16.6%), and IBIT has climbed from 46.73 to 54.58 (+16.8%).
What now? My work argues that the best is yet to come! If my opportunistic setup work dovetails with your interests and research on BTC, individual stocks, market indices, and ETFs, precious metals, oil, etc., join me and MPTraders for our ongoing analysis and discussions at MPTrader.com.
Mike Paulenoff is the author of MPTrader.com, a real-time diary of his technical analysis & trade alerts
on
ETFs for precious metals, energy, currencies, and an array of equity indices and sectors, including
international
markets, plus key ETF component stocks in sectors like technology, mining, and banking.
Sign up for a Free 7-day Trial!
More Top Calls From Mike
Pharma Update: MRK and LLYOn Wednesday (6/24/26), this is what we discussed about MRK:MRK as well, which we see on my attached Daily Chart exhbits a VERY BULLISH technical setup-- quite the opposite of beleaguered PFE. My pattern work argues that all of the price action from the 2/25/26 high at 125.14 represents a high-level bullish digestion period and pattern atop the major upleg from the May 2025 low at 73.31.
On January 2, 2026, this is what I posted about CAVA (Cava Group Casual Mediterranean Cuisine) to MPTrader members:After CAVA's meteoric climb from 29.00 in October 2023 to an ATH at 172.65 in November 2024, the stock rolled over into a relentless decline that hit its low at 43.
On the morning of April 9, 2026, this is what I posted about SMR (NuScale Power Corp) to our Discussion Room for MPTrader members:SMR (Nuscale Power Corp)-- Three views of this beleaguered, former high-flying modular nuclear power producer that has been in the grasp of a relentless six-month, 84% bear phase:-- From the perspective of my 4-hour Chart, SMR has the right look of nearing the completion of the downleg that started at the Jan. 2026 recovery rally high of 22.
On the morning of April 7, 2026, this is what I posted for MPTrader members about my interpretation of the near-term technical setup exhibited by META:My preferred technical scenario for META argues that the stock established a significant near-term low at 520.00 on 3/27/26 that resides within an August 2025 to March 2026, incomplete larger corrective process.
Thirty minutes after the opening bell on November 24, 2025, I posted the following heads-up to MPTrader members about the technical setup in META:META has the right technical look of a significant U-Turn to the upside after completing a 27% August-November correction from 796.25 (8/15/25) to 580.32 (11/21/25)... To gain more powerful upside traction, META needs to climb and sustain above nearest-term resistance at 614.70 to 616.50, which if (when) taken out, will open a higher price pathway to the 670 area to challenge the down-sloping 200 DMA... Last is 609.27...