My Weekly Cash S&P Technical Setup Argues the Index Still Has Unfinished Business on the Upside
Last Friday morning, to calm frazzled nerves amid a 1% pre-market plunge that was threatening to complete a 100% give back of the prior week's 3.8% recovery rally, this is what we discussed:
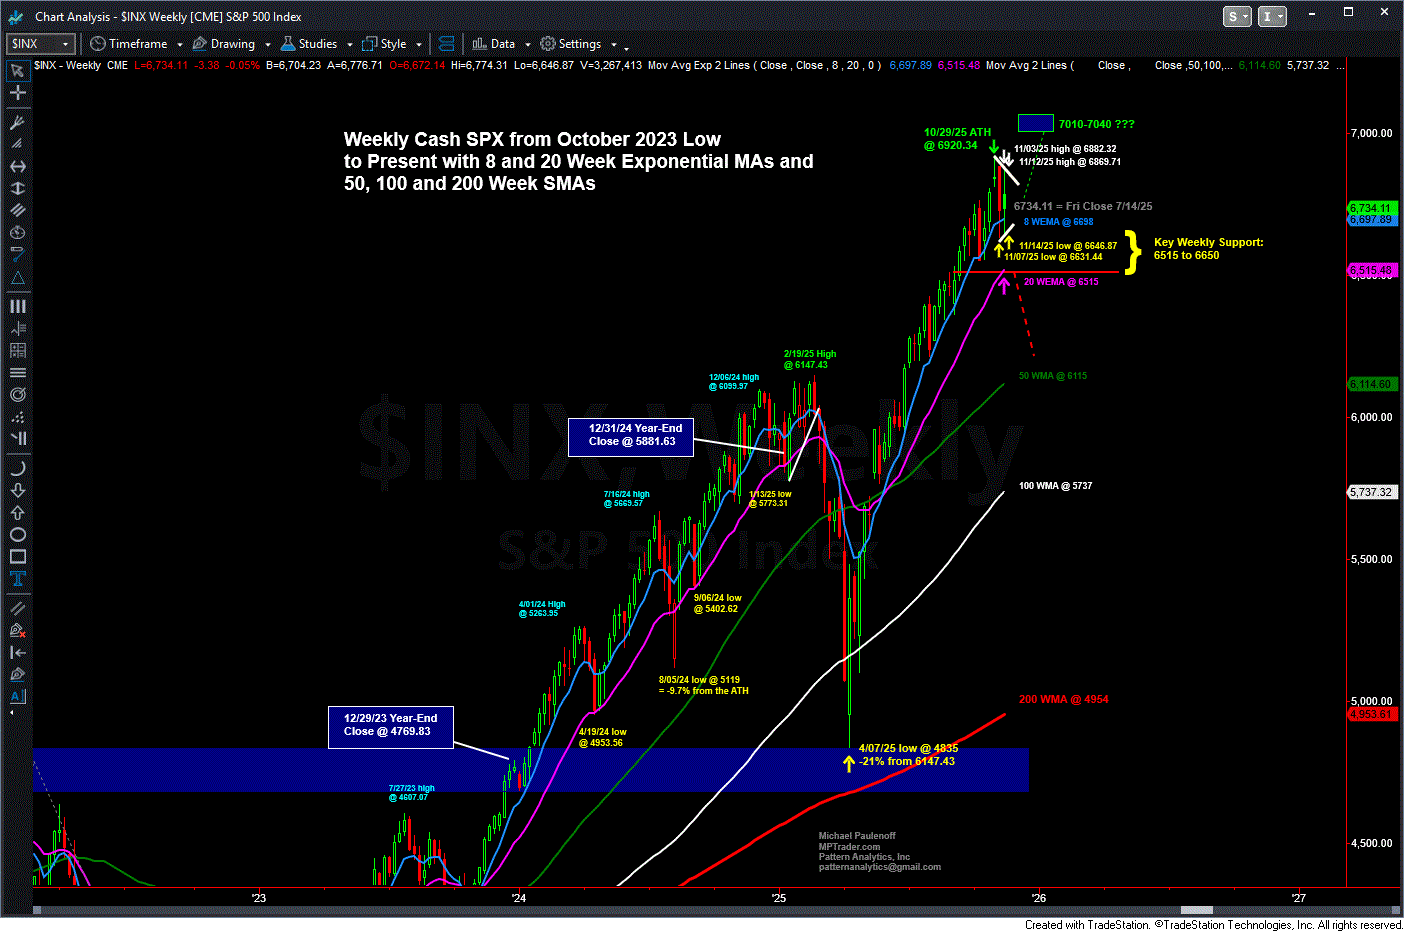
From a VERY BIG PICTURE CHART perspective, in an effort to provide perspective on the apparently intense emotional component of the current sell-off (read: FEAR), my attached WEEKLY Chart of Cash SPX shows this week's still green Candle situated "inside" of last week's much larger Red Candle, otherwise known as an "inside week" that denotes sideways digestion (distinct from bearish price action). That said, if weakness persists and SPX presses through support from 6630 down to 6520, then my Weekly Chart Work will roll over into a top formation...
Seeing the powerful, dominant Weekly Chart of the Cash SPX (attached Below) provided a measure of price objectivity for MPTraders, overlaid on an extremely volatile, emotional period fraught with uncertainty about big tech overvaluations, gargantuan spending, and circuitous build-out financing that combined to create rapidly escalating investor doubts about timely use-cases, new revenue streams, and profitability in the AI universe.
That said, however, within minutes after Friday's opening bell, SPX made its intraday and weekly low at 6646.87, and after which, embarked on a multi-hour 2% recovery rally ahead of a close circling unchanged for the day and slightly higher for the week.
From my BIG Picture Weekly Chart of the Cash SPX, after two extremely volatile weeks during which the index traversed a range of 225 to 250 points and 3.5% to 3.8%, my pattern work argues that the 43% post-April 2025 bull run from 4835 (4/07/25) to 6920.34 (10/29/25) is in the grasp of a high-level rest-digestion period that has unfinished business on the upside, and is setting up for another upleg that will retest and hurdle the ATH at 6920 en route to 7010/40...
Only a resumption of weakness that breaks the 11/07/25 and 11/14/25 Weekly Lows (see my attached Weekly Chart) and then follows through to the downside to violate 6515, will invalidate and reverse my currently constructive technical outlook.
And now that the Government has reopened, there will be plenty of potentially meaningful directional catalysts for traders and investors to evaluate and digest that could move markets (triggered by algorithmic knee-jerk reactions to the news:
Wednesday-- Fed Meeting Minutes... NVDA Earnings Report after the close...
Thursday-- September Jobs Report ... Philly Fed Manufacturing data... October Existing Home Sales data
Friday-- November Services PMI data... November Manufacturing PMI data... MI Consumer Sentiment data... Michigan Inflation Expectations data...
During the course of the week: 14 Fed Speakers...

