Off of the Beaten (Technology) Path: Under the Radar XOM (Exxon Mobil) Exhibits a Very Bullish Technical Setup
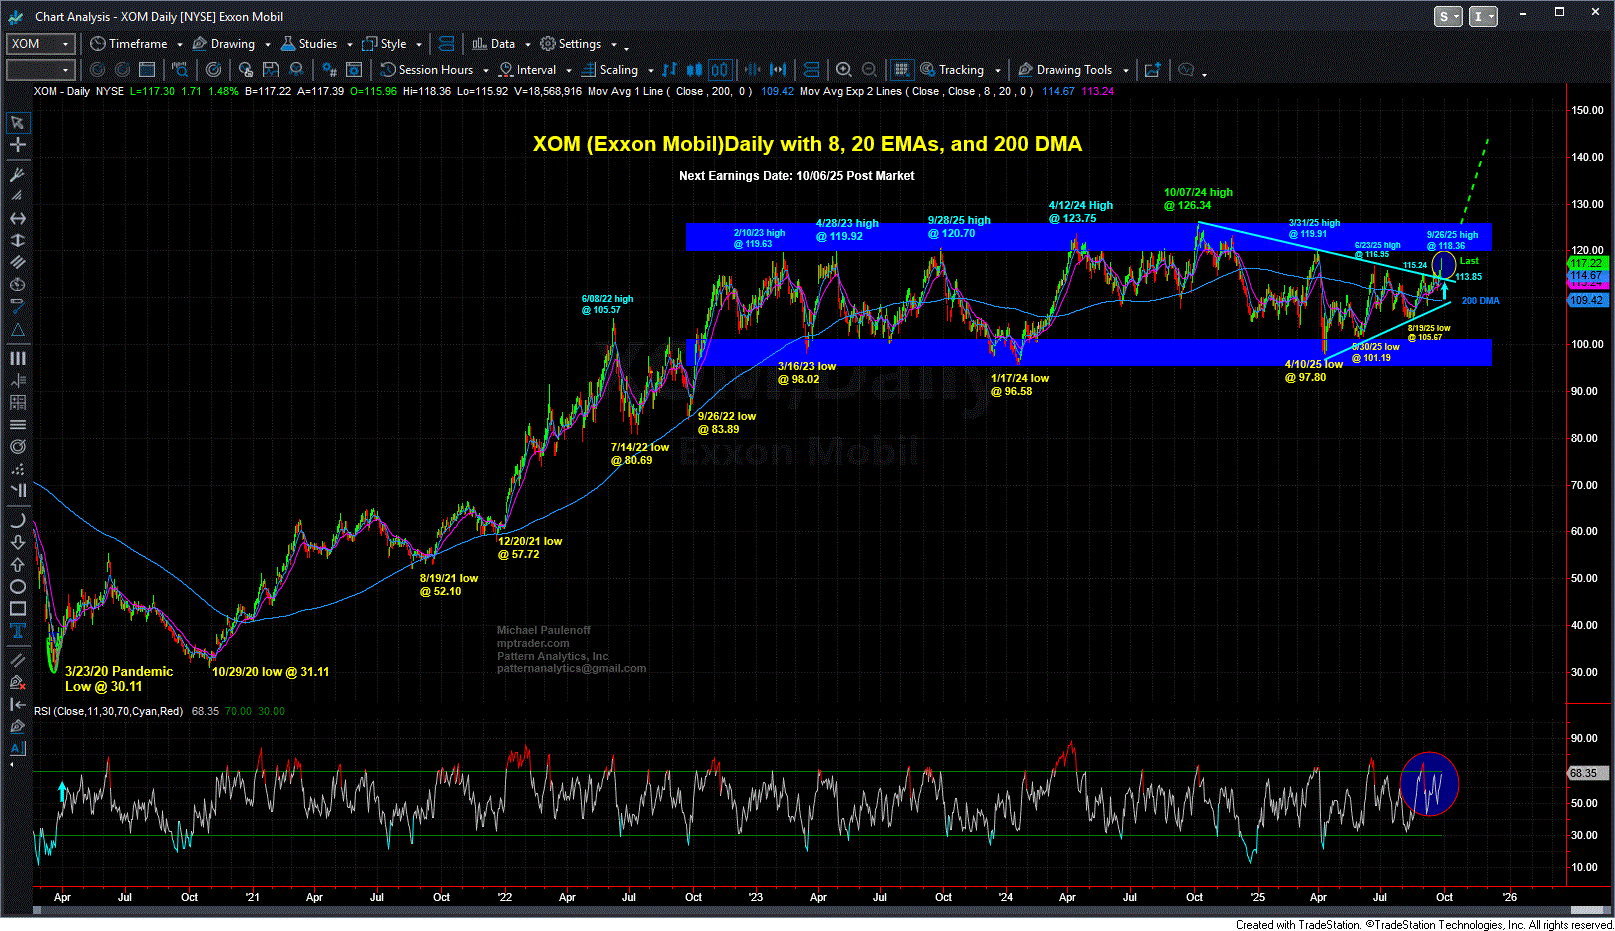
Late on Friday, fellow MPTrader member MarkinQueens exclaimed: Mike's XOM (Exxon Mobil) chart from August is working! Last $117.26!
Back on August 25th, this is what we discussed about Crude Oil and XOM:
Just in case anyone is wondering what the chart of nearby Crude Oil is looking like as we approach the "official" end of summer. The price structure is betwixt and between, but I would think at $65/bbl, the major producers are making money hand over fist, as they say, despite drill, baby, drill...perhaps in anticipation of much stronger global growth? Last is 64.75... Maybe that is why XOM (ExxonMobil) exhibits a setup that argues for an upside thrust out of a prolonged high-level digestion period (see my attached Daily Chart), provided any forthcoming weakness is contained above 105.50... BTW, XOM pays a 4% dividend too... Last is 111.62...
Fast-forward to this past Friday's close (9/26/25) at 117.22, a full 5% above my 8/25/25 update, we see on my Daily XOM Chart setup that the price structure has thrust above an 11-1/2 month resistance line (113.85), from where it climbed to 118.26 so far (closing at 117.22).
Technically, the upside breakout positions XOM for a challenge of much more consequential resistance between 119.50 and 124.50, which if hurdled and sustained, will position XOM for upside continuation that has much higher upside potential. Let's notice on the Daily Chart setup that last week's upside thrust emerged from just ABOVE the horizonatally-sloped 200 DMA and above the up-sloping 8 and 20 Day EMAs, placing the price structure in a bullish technical posture.
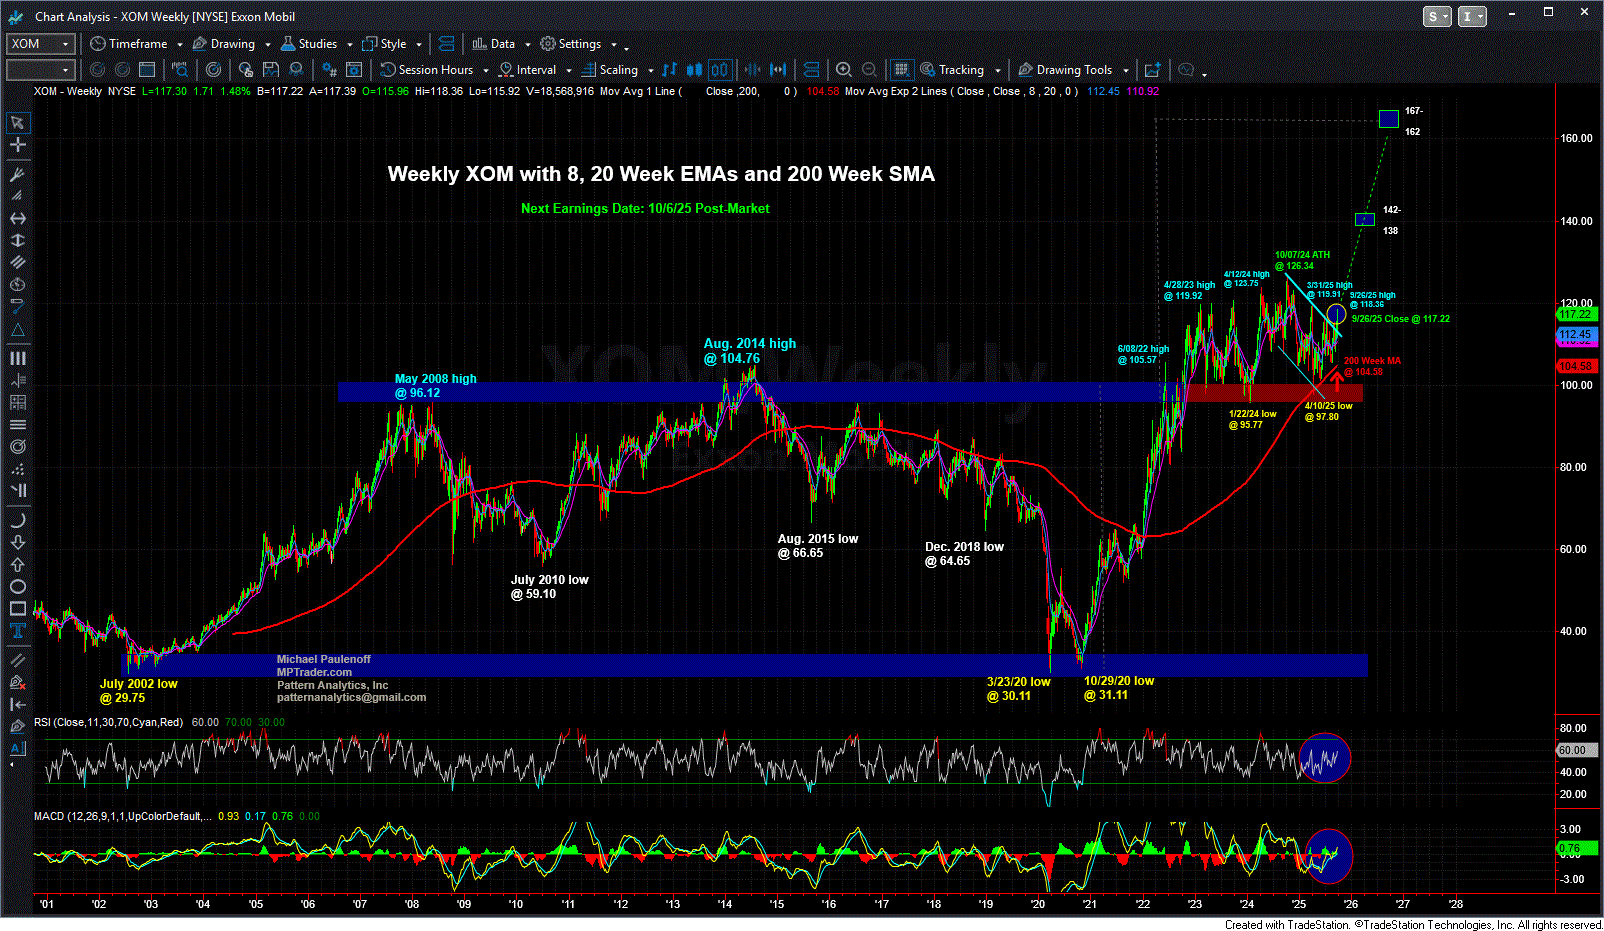
Next, take a look at my attached Weekly Chart setup. What leaps out at me is the juxtaposition of the sharply up-sloping 200 WEEK MA at 104.58, and the price structure, from where XOM pivoted to the upside in early August, and which has propelled prices powerfully higher. The Weekly MA and technical setup argue that XOM is in the early stages of a new bull phase.
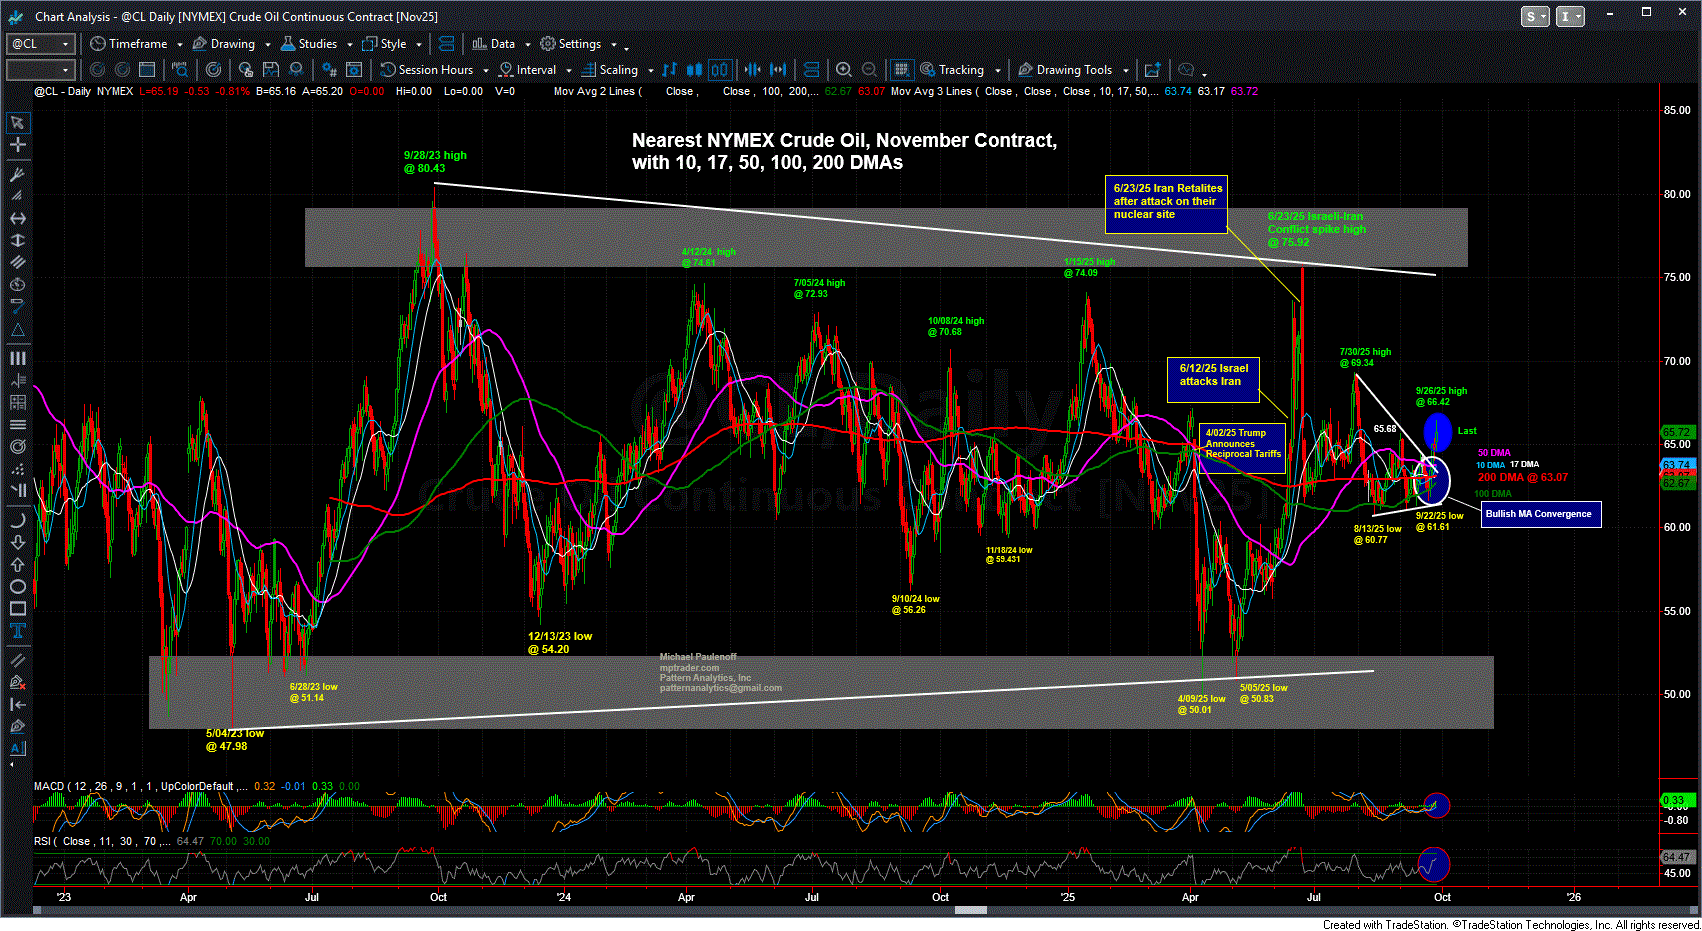
As for NYMEX Oil prices, my attached November Crude Oil Chart setup shows multiple failed attempts to press beneath $60-$61 support, followed by last week's upside pivot reversal and climb to $66.42 (+8%). Furthermore, let's notice that last week's upside surge emerged from a convergence of near and intermediate-term MAs in the $62.50-$63.70 area, from where November Crude motored $2 to $3 higher. As long as any forthcoming weakness is contained above $62.60 on a closing basis, November Crude Oil is poised for upside continuation...
Why? Maybe the fossil fuel energy markets are anticipating a colder-than-normal winter in North America?
Otherwise, perhaps the economic and monetary stimulus from the Big Beautiful Bill is starting to kick in? Maybe a total of 75 bps of Fed Rate Cuts overlaid on falling interest rates by most of the global central banks is also underpinning greater growth, increasing demand for Oil, and higher commodity inflation?
And then there is the prospect of a deal between the U.S. and China that unleashes more growth in the Chinese economy? Or, maybe the West is successful in curtailing Russian oil sales to "squeeze" Russian President Putin to force him to the negotiating table to end the war with Ukraine?
Maybe all of the above will converge to propel XOM and Oil prices higher in the weeks and months ahead? Who knows?
The technical conditions are "warning" me that just such a scenario is on the front burner for the Energy Sector... MJP