Market Analysis for Sep 16th, 2025

by Mike Paulenoff
September 16, 2025 • 1:01 PM EDT
ARKK (ARK Innovation Fund, ETF)-- Back on August 20, 2025, this is what we discussed about ARKK:
Fellow member Pawel has requested an update on Cathie Wood's fund, which in June thrust up and out of a 3-1/2 year base-accumulation period and pattern above 68.40/50 that subsequently climbed to my initial target in the vicinity of 80 (see my attached Daily Chart).
Since the 7/21/25 high at 79.19, ARK has been in the grasp of a high-level digestion formation between 70 and 79, but at this time does not look complete. Current weakness into today's low at 71.28 looks like it still "needs" one more new low beneath 70.40-- that could press into the 65-68 support Target Window-- before my pattern work indicates ARKK will be poised for upside continuation that projects next to 88 to 92... Last is 73.10...
Fast-forward to today, we see that late last week, ARKK thrust out of the "high level digestion formation" discussed on August 20th, and has continued higher to new multi-year highs at 80.46 so far.
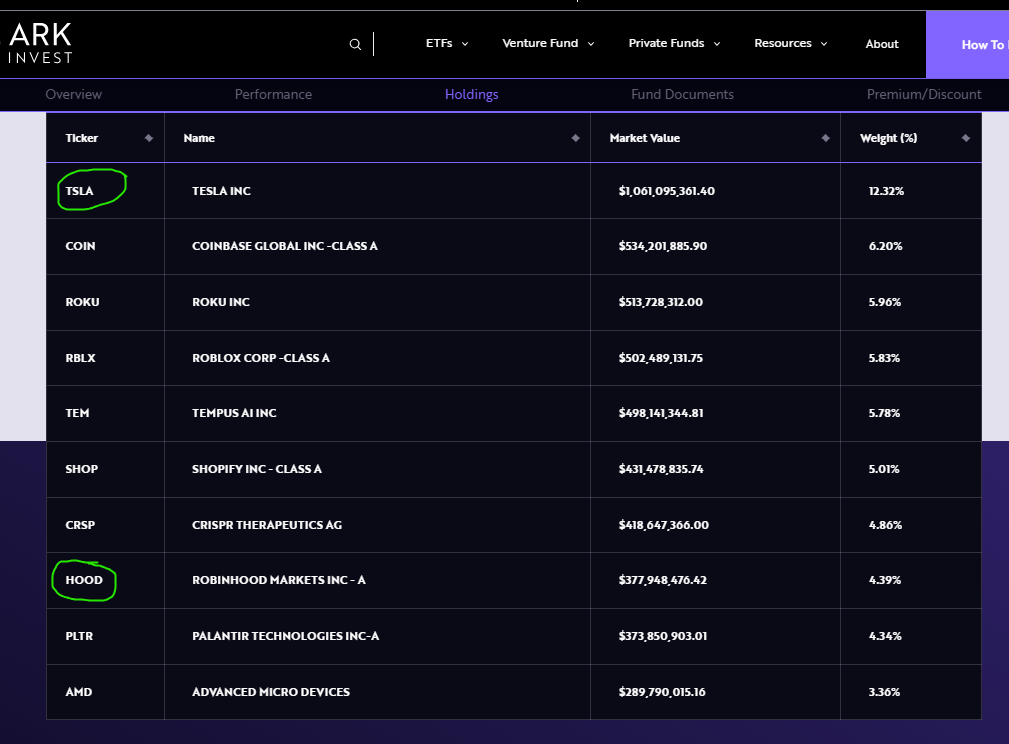
The fact that TSLA represents over 12% of ARKK, which has climbed 23% in the past several days, certainly has had a disproportionately bullish impact on ARKK (see Top 10 Holdings attached below).
My work on TSLA argues for additional near-term strength into the 440-450 area from 415-420 (418.60 last), which will continue to provide powerful tailwinds for additional ARKK price strength into the 82-84 next immediate target zone, en route to my optimal objective of 88 to 92...
Only a sudden downside reversal that presses ARKK beneath 76.50 will send us a technical warning signal that ARKK's post-April upmove from 38.57 is taking a breather... Last is 80.44...
Mike Paulenoff is the author of MPTrader.com, a real-time diary of his technical analysis & trade alerts
on
ETFs for precious metals, energy, currencies, and an array of equity indices and sectors, including
international
markets, plus key ETF component stocks in sectors like technology, mining, and banking.
Sign up for a Free 7-day Trial!
More Top Calls From Mike
Pharma Update: MRK and LLYOn Wednesday (6/24/26), this is what we discussed about MRK:MRK as well, which we see on my attached Daily Chart exhbits a VERY BULLISH technical setup-- quite the opposite of beleaguered PFE. My pattern work argues that all of the price action from the 2/25/26 high at 125.14 represents a high-level bullish digestion period and pattern atop the major upleg from the May 2025 low at 73.31.
On January 2, 2026, this is what I posted about CAVA (Cava Group Casual Mediterranean Cuisine) to MPTrader members:After CAVA's meteoric climb from 29.00 in October 2023 to an ATH at 172.65 in November 2024, the stock rolled over into a relentless decline that hit its low at 43.
On the morning of April 9, 2026, this is what I posted about SMR (NuScale Power Corp) to our Discussion Room for MPTrader members:SMR (Nuscale Power Corp)-- Three views of this beleaguered, former high-flying modular nuclear power producer that has been in the grasp of a relentless six-month, 84% bear phase:-- From the perspective of my 4-hour Chart, SMR has the right look of nearing the completion of the downleg that started at the Jan. 2026 recovery rally high of 22.
On the morning of April 7, 2026, this is what I posted for MPTrader members about my interpretation of the near-term technical setup exhibited by META:My preferred technical scenario for META argues that the stock established a significant near-term low at 520.00 on 3/27/26 that resides within an August 2025 to March 2026, incomplete larger corrective process.
Thirty minutes after the opening bell on November 24, 2025, I posted the following heads-up to MPTrader members about the technical setup in META:META has the right technical look of a significant U-Turn to the upside after completing a 27% August-November correction from 796.25 (8/15/25) to 580.32 (11/21/25)... To gain more powerful upside traction, META needs to climb and sustain above nearest-term resistance at 614.70 to 616.50, which if (when) taken out, will open a higher price pathway to the 670 area to challenge the down-sloping 200 DMA... Last is 609.27...