Bearish Call On Home Builders ... What's Next For ITB?

by Mike Paulenoff
June 19, 2022 • 12:00 AM EDT
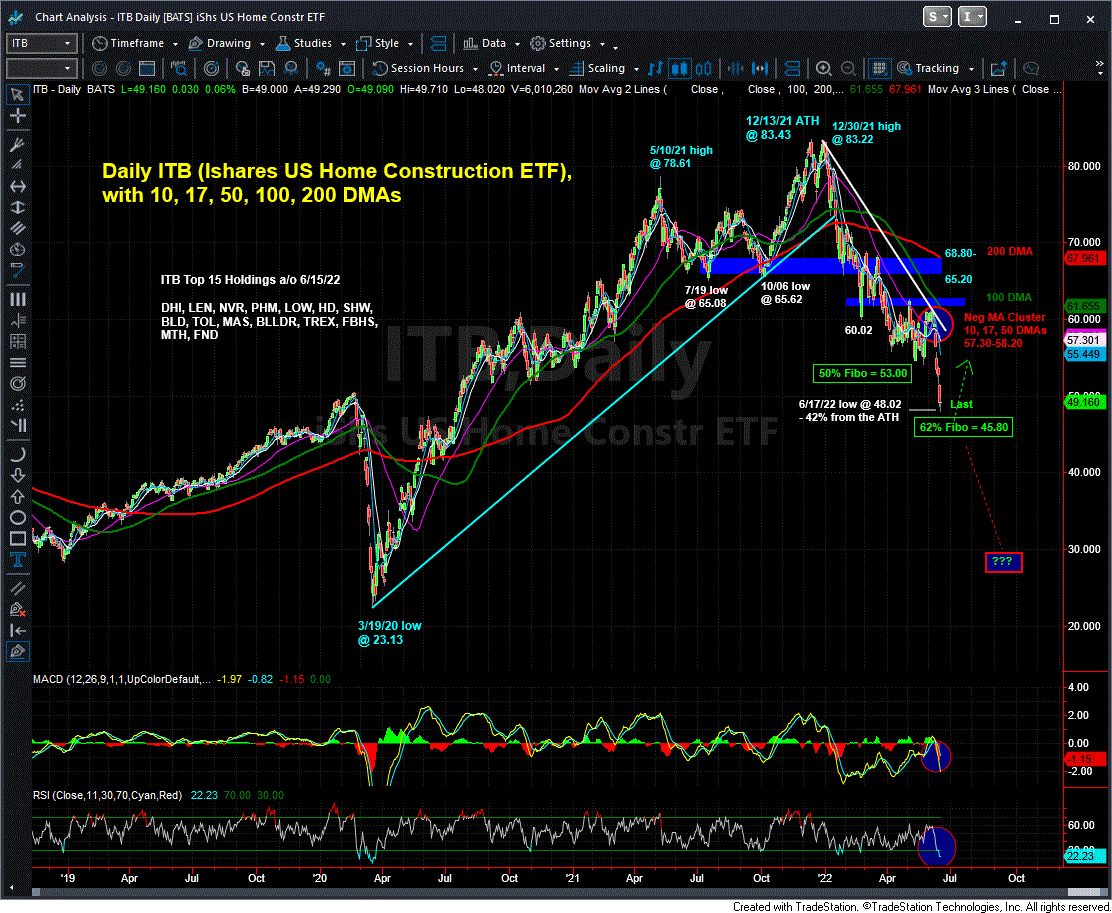
Last Wednesday, prior to the official FOMC rate hike of 75 bps, Mike Paulenoff warned MPTrader members about the likelihood of additional weakness in the beleaguered home builders, writing about the ITB (iShares US Home Construction ETF):
"In that, neither my pattern work nor my intermediate-term Momentum gauges offer much technical confidence that ITB will be able to carve out a meaningful corrective basing area in and around 53.00, I am expecting the price structure to head still lower to test the next key Fibonacci support plateau in and around 46.00."
Mike added, "The fact that the Fed intends to maintain its rate hike cycle through Q3, 2022 at a minimum (unless today's FOMC policy statement and Powell press conference change the timeline), and given the sharp back-up in mortgage rates, the crash in demand for mortgages, the slowdown in economic growth (recession?), and residual upward pressure on prices in general, and housing in particular, the prospects for a powerful, sustained upside reversal in ITB appears low-to-none."
ITB, which was trading at 53.18 at the time, proceeded to nosedive into Friday's late-session 11-month corrective low at 48.02, a down-move of 9.7%, bearing down on Mike's next lower key technical level at 45.80-4600, which represents the Fibonacci 62% support plateau of the entire post-March 2020 Pandemic bull phase.
The ability of ITB to contain further weakness in and around 46.00 will provide Mike with valuable technical and macro market information about the underlying strength or weakness of the housing sector, the consumer, and the outlook for mortgages (longer-term interest rates). Mike's work argues that ITB buyers need to emerge to imbue an otherwise dismal and still-deteriorating intermediate-term technical setup with an initial measure of confidence to avert triggering the potential for a "death spiral" in the housing and home building sectors.
Join Mike and MPTrader members next week as they monitor, chart, and discuss the ITB as well as many individual names, ETFs, macro indices, commodities, Bitcoin, and Precious Metals miners in real-time as they brain-storm hour-to-hour navigation of the current challenging trader and investor environment.
In the early afternoon on April 11, this was my note to our members:"IBIT (iShares Bitcoin Trust ETF)-- From a trading perspective, anyone who is in sync with the Bitcoin setup might consider owning IBIT (iShares Bitcoin ETF) against a stop below its 4/07/25 low at 42.98 (see my attached Daily Chart below)...
Last Thursday (4/17/25) afternoon, ahead of NFLX (Netflix) post-close earnings report and the three-day Good Friday holiday weekend, we discussed the technical setup and whether or not the NFLX pattern was positioned to react positively to the news : The NFLX setup heading into Earnings later today is favorable for upside continuation above the prior two rally highs at 993.45 (4/15) and 998.70 (3/25), but not to a new ATH above 1064.
Last Thursday afternoon (4/10/25), the commentary below is what I discussed with MPTrader members about my Big Picture technical setup work: Tomorrow is the final session of the week. We get some big bank Earnings and PPI before the open, and more than likely, one or more POTUS televised events that undoubtedly will move markets one way or other. Technically, tomorrow's (Friday) close will be important to my Weekly Chart Work.
At the beginning of last week, fellow members Rayray and GordonGekko asked for my technical setup work on BX (Blackstone Inc). This is what we discussed on the morning of March 25, 2025:My attached Daily Chart shows the November 2024 to mid-March 2025 correction (-32%) followed by the recovery rally from 135.60 to 153.18.
On March 10, 2025, fifteen minutes before the closing bell and Oracle's forthcoming Earnings Report, below was the analysis I posted to the MPTrader Discussion Room about ORCL:"... My preferred scenario indicates a negative reaction to the news that sends ORCL reeling to test important support at 139.50-141.20-- where ORCL MUST reverse to the upside to avert triggering still lower projections into the 118-123 (back the truck up) target window... Last is 149.32"...

