Eye On AAPL As Bellwether For Broader Market
On March 11, with AAPL in a month-long down-leg and trading at 156.34, Mike Paulenoff posted a relatively bullish analysis for MPTrader members, writing:
"I am watching AAPL more closely than usual these days, as a bellwether for the health/vulnerability of the overall market. The BIG picture currently has the look of a correction within the larger, dominant uptrend, however, a bout of weakness that presses beneath the 152-156 support zone will morph the correction into a potentially damaging top formation that has breached BOTH the 200 DMA and a major up trendline. As long as 152 to 156 contains any forthcoming weakness, the bulls remain in charge... but very nervously at the moment, I might add.”
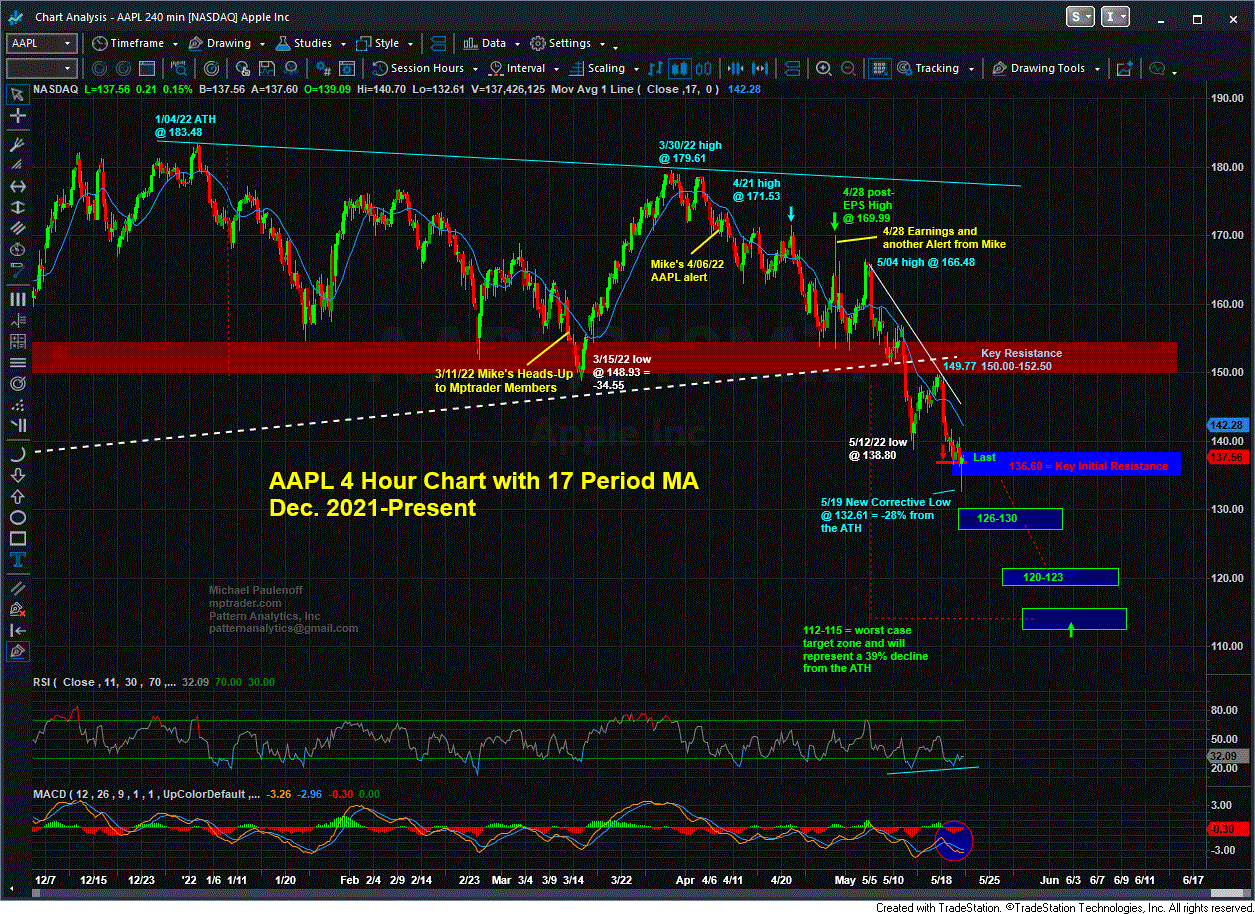
AAPL went on to rally to above 179 by the end of the month, prompting this technical alert by Mike on April 6:
"The powerful vertical advance from 148.93 on 3/14/22 to a 179.61 high on 3/30/22 (+21%) exhibited bullish form, which on its face ‘warns us’ that 1) AAPL could have initiated a new bull leg, and 2) that after a pullback, more upside is ahead the strength of which EITHER will confirm that AAPL is leading the market to new highs, OR alternatively, if AAPL's next bout of strength fails to make new ATHs, that all of the action off of its mid-March low is an ‘intervening rally’ ahead of another 20% to 30% down-leg within a larger-developing intermediate-term correction from the January high."
AAPL was unable to rally above its March 30 recovery rally high at 179.61 and instead turned down, though popped a bit on release of its earnings on April 28, prompting this comment from Mike that evening:
"My sense is that AAPL's strength (in reaction to earnings) was ‘used’ by investors as a ‘sell-the-news’ event for whatever reason... Let's see where AAPL is trading after the Conference Call, and thereafter, heading into tomorrow's open... Last is 165.40, now just 1% above the 4 PM Close."
It was all downhill for AAPL after its late April earnings report. Mike's attached chart of AAPL price action shows the relentless stair-step decline from the Bull Trap rally high at 169.99 immediately in reaction to the April earnings report into last Friday's (May 12) multi-month corrective low at 132.61. That’s a full 28% from AAPL's all-time high at 183.48 on January 4, also the day of the high of the S&P 500.
Late on Friday, AAPL recovered sharply from 132.61 to close slightly green on the day at 137.56, 3.7% off of its intraday and multi-month corrective low.
Is the correction over, or is AAPL merely catching its breath from an exhausted, oversold condition? Join Mike and MPTrader members for their intraday discussions and analysis of AAPL as well as many other stocks, ETFs, Macro Indices, Commodities, and Bitcoin.

