Getting The Jump on JPM's Decline ... What's Next For The Stock and For Financials In General?

by Mike Paulenoff
May 15, 2022 • 10:04 AM EDT
Back on March 1, 2022, Mike Paulenoff posted a technical "heads-up" about JPM for members of MPTrader.com, writing:
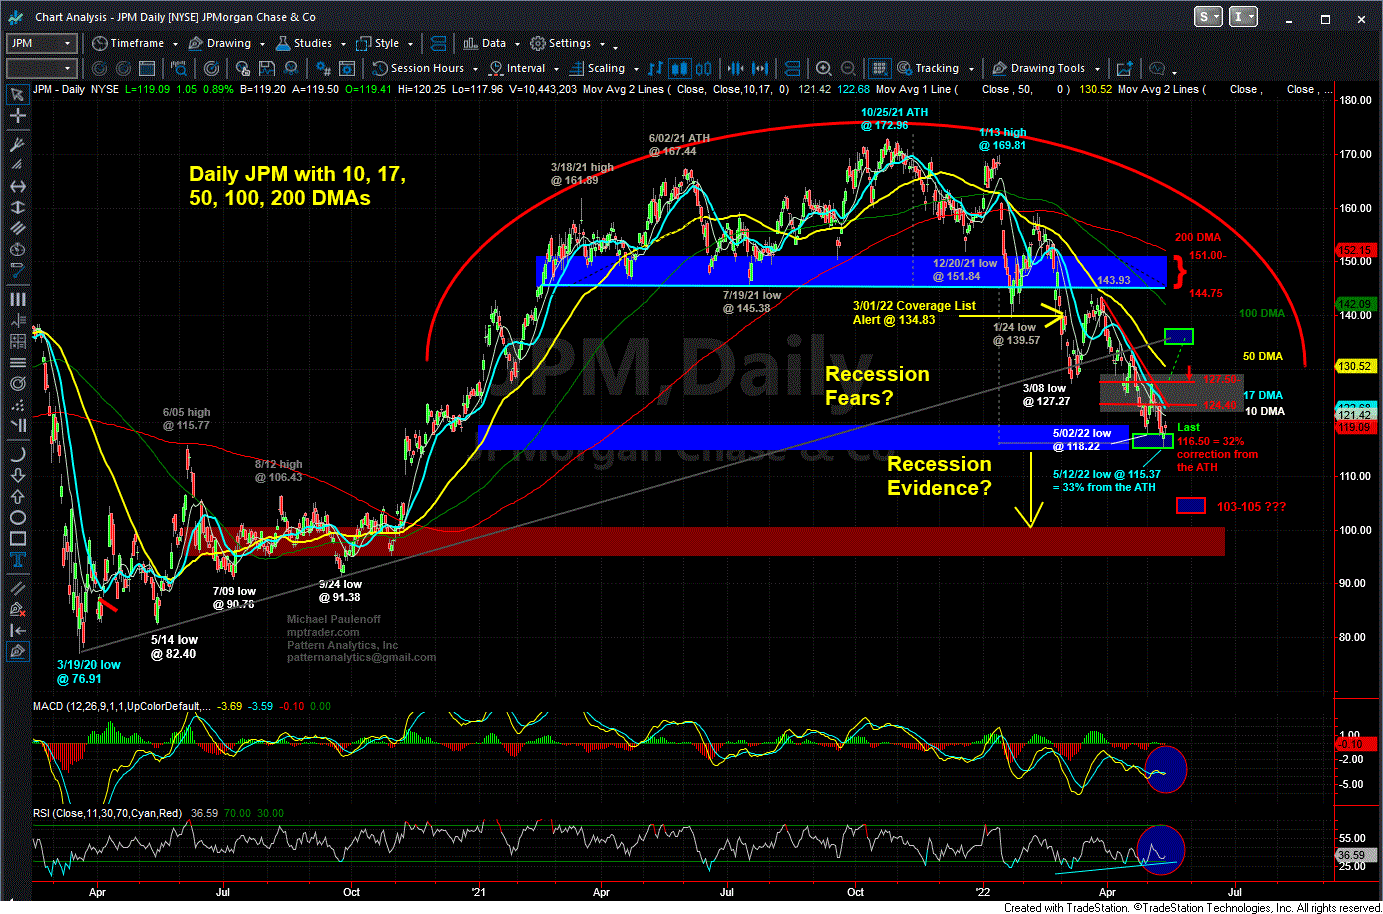
"JPM has broken down in glaring fashion from a 12-month Top Formation that my pattern work addressed four weeks ago in case JPM sustained beneath 139-140. Today's low at 134.15 violated my shallowest target zone of 135.50-137.50, and points next to 128-130, with an outlier target zone in the vicinity of 115. With XLF amounting to 12% of the S&P 500, judging from the ugly setup in JPM (10% of the XLF), I doubt we will be seeing XLF leading or making a major contribution to SPX index strength anytime soon."
JPM, which was trading at 134.83 at the time, has since declined 14.5%. It hit a corrective low this past Thursday at 115.37, right in Mike's "outlier target zone," and a full 33% off of its all-time-high at 172.96 from October 25, 2021.
What does Mike think about JPM going forward? According to Mike, who has been tracking the stock with nearly a dozen technical updates since March1, unless and until JPM can recover to and climb above resistance from 124.40 to 127.50, JPM will remain "challenged" by intense macro headwinds and continue to project a setup that suggests JPM and the big money center banks are foretelling the potential for a severe U.S. economic slowdown.
Join Mike and our MPTrader members for ongoing intraday discussions about JPM as well as many other stocks, ETFs, macro indices, commodities, and Bitcoin that will help you manage risk and identify actionable trading and investing setups.
Mike Paulenoff is the author of MPTrader.com, a real-time diary of his technical analysis & trade alerts on
ETFs for precious metals, energy, currencies, and an array of equity indices and sectors, including international
markets, plus key ETF component stocks in sectors like technology, mining, and banking.
Sign up for a Free 7-day Trial!
More Top Calls From Mike
In the early afternoon on April 11, this was my note to our members:"IBIT (iShares Bitcoin Trust ETF)-- From a trading perspective, anyone who is in sync with the Bitcoin setup might consider owning IBIT (iShares Bitcoin ETF) against a stop below its 4/07/25 low at 42.98 (see my attached Daily Chart below)...
Last Thursday (4/17/25) afternoon, ahead of NFLX (Netflix) post-close earnings report and the three-day Good Friday holiday weekend, we discussed the technical setup and whether or not the NFLX pattern was positioned to react positively to the news : The NFLX setup heading into Earnings later today is favorable for upside continuation above the prior two rally highs at 993.45 (4/15) and 998.70 (3/25), but not to a new ATH above 1064.
Last Thursday afternoon (4/10/25), the commentary below is what I discussed with MPTrader members about my Big Picture technical setup work: Tomorrow is the final session of the week. We get some big bank Earnings and PPI before the open, and more than likely, one or more POTUS televised events that undoubtedly will move markets one way or other. Technically, tomorrow's (Friday) close will be important to my Weekly Chart Work.
At the beginning of last week, fellow members Rayray and GordonGekko asked for my technical setup work on BX (Blackstone Inc). This is what we discussed on the morning of March 25, 2025:My attached Daily Chart shows the November 2024 to mid-March 2025 correction (-32%) followed by the recovery rally from 135.60 to 153.18.
On March 10, 2025, fifteen minutes before the closing bell and Oracle's forthcoming Earnings Report, below was the analysis I posted to the MPTrader Discussion Room about ORCL:"... My preferred scenario indicates a negative reaction to the news that sends ORCL reeling to test important support at 139.50-141.20-- where ORCL MUST reverse to the upside to avert triggering still lower projections into the 118-123 (back the truck up) target window... Last is 149.32"...

