On the morning of April 9, 2026, this is what I posted about SMR (NuScale Power Corp) to our Discussion Room for MPTrader members:
SMR (Nuscale Power Corp)-- Three views of this beleaguered, former high-flying modular nuclear power producer that has been in the grasp of a relentless six-month, 84% bear phase:
-- From the perspective of my 4-hour Chart, SMR has the right look of nearing the completion of the downleg that started at the Jan. 2026 recovery rally high of 22.37 that so far, has pressed to a low of 9.14 (4/07/26) amid a glaring positive Momentum divergence (see yellow oval atop the chart), which is a warning signal that the January-April 2026 downleg is showing signs of selling exhaustion. That said, to trigger an initial upside reversal signal, SMR needs to climb and sustain above 10.35 for starters...
-- From the perspective of my attached Big Picture Daily Chart, I can make a compelling technical argument that the larger bear phase has the right look of being in the final down-ticks of the stair-step decline from the 57.42 ATH on 10/16/25. That said, SMR needs to show some strength to enter a two-way trading environment (from a one-way downside setup). To do so-- similar to the 4-Hour setup, SMR needs to climb and close above 11.20 for starters, and then follow through to test the sharply down-sloping 50 DMA, now at 13.17.
Let's notice on the Daily Chart that this week's 1-1/2 year new low at 9.14 was NOT confirmed by intermediate-term Momentum (see yellow ovals at the bottom of the chart). The Momentum low was confirmed at the 11/21/25 price low at 16.96. This week's 9.14 is nearly 50% lower than the confirmed low, which warns me that, barring some sort of existential situation (fraud et al, for instance), SMR is nearing a potentially generational entry window...
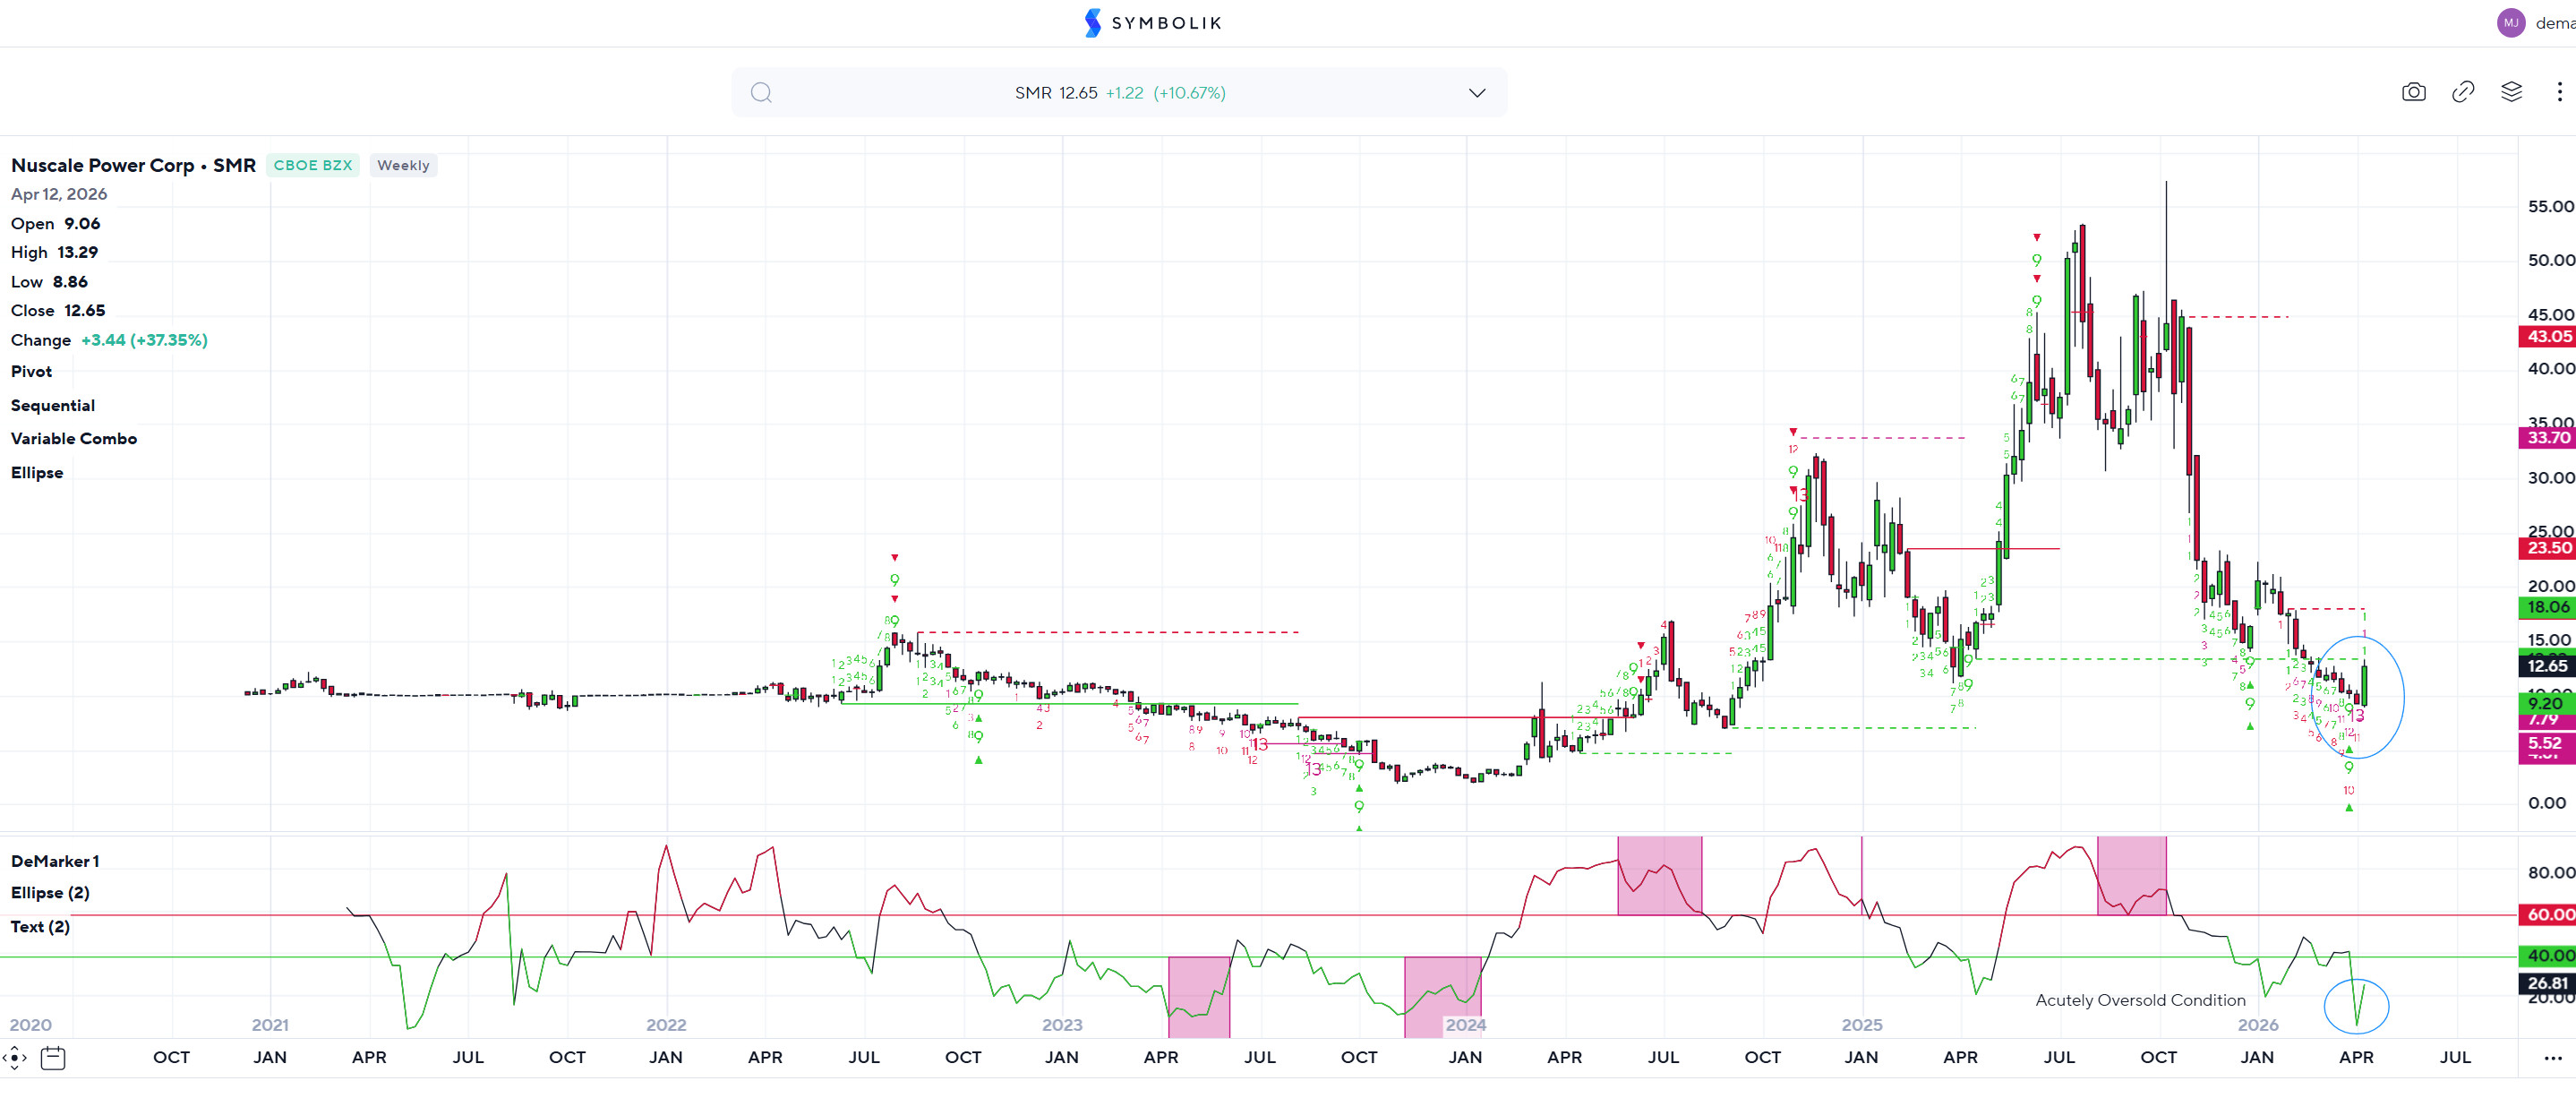
-- Finally, I have posted the Weekly Chart of SMR overlaid with the DeMark Exhaustion Signals, which show an acutely exhausted maximum oversold reading of 13. While this reading certainly does not tell us WHEN SMR will turn up, it does tell us that it will have the potential to be a rip-your-face-off sling-shot advance...
Bottom Line: From a technical perspective, SMR has a plethora of anecdotal evidence indicating a major U-Turn is nearing quickly. Unless and until it climbs and closes above 11.20/35, however, I cannot rule out lower-lows that project next into the 8.50 target level... last is 9.59...
-------------------------------------
Fast-forward 7 trading days to the end of last week, we see on my attached 4-Hour Chart that SMR pivoted from a 19-month low at 8.85 into a powerful rally that hit a high of 13.24 on Thursday (4/16/26)-- a 50% gain from the 8.85 low!-- closing on Friday (4/17/26) at 12.78-- full 33% above the price SMR was trading at the time of my April 9th post to the MPTrader Discussion Room.
Although SMR benefited from both an acute oversold condition (shown on my attached Symbolik SMR Weekly Chart overlaid by the DeMark Exhaustion Signals) and the broad, sympathetic, powerful advance in the equity market indices, my pattern and momentum setup work indicates that last week's strength is the initiation of an accumulation bottoming process ahead of an intermediate-term rally period that likely will be underpinned by a return of capital flows into the modular nuclear energy names amid a prolonged period of elevated oil prices that threaten to hamper exponentially increasing energy demand necessary to drive U.S. economic growth into 2030.
Clean, efficient, safe nuclear energy will be a vital component of America's energy mix in the years ahead, and will be promoted and subsidized by current and future Administrations.
Helping MPTrader members navigate price swings during the bottoming process in SMR is, and will remain, my focus in the days and weeks to come.
Join our members and me for our real-time, opportunistic discussions about SMR and many other individual stocks, ETFs, macro indices, commodities, precious metals, and cryptocurrencies, as well as your requests for my chart analysis of stocks and ETFs in your own portfolios...