XOM (Exxon Mobil)-- Back on May 19, 2026, a fellow MPTrader member requested an update on XOM. This is what we discussed at that time:
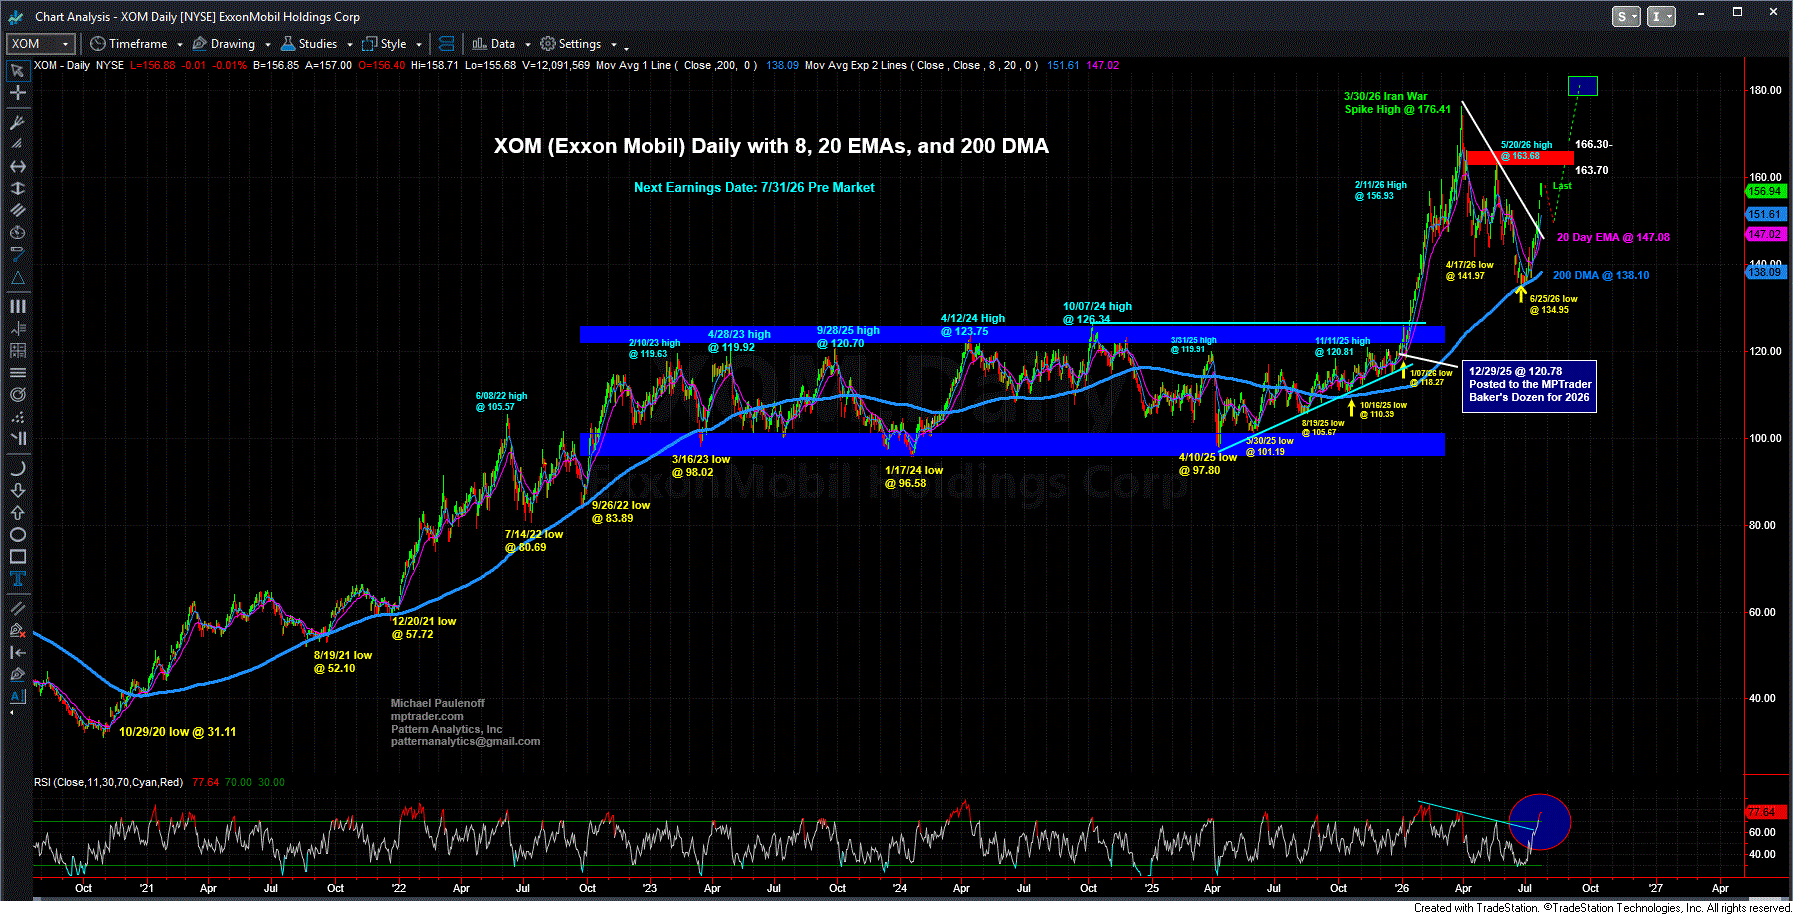
My attached Daily Chart setup shows my preferred scenario calling for a near-term peak of the current upmove from the 4/17 low at 141.97 to a target zone from 162 to 165, followed by a rollover and press lower that revisits and possibly breaks the 41/7 low, which also will complete the larger corrective process from the 3/30/26 ATH at 176.41. In other words, my pattern work considers all the price action from the 3/30/26 ATH at 176.41 to represent an incomplete major correction that has "another shoe to drop" before XOM embarks on a new upleg... Last is 161.07...
Below is the chart I posted on May 19, 2026, showing my extrapolated, preferred price path for XOM, and the recovery rally into my optimal recovery rally target zone from 162 to 165 ahead of an anticipated secondary corrective decline toward 136-138 ahead of a resumption of buying interest. In fact, a second shoe did drop, which resulted in a nosedive in XOM to a low at 134.95 on 6/25/26, just below my optimal pullback support window. From the 134.95 low on 6/26/26, XOM's price action has been nothing but up, up, and away. What's next? (Continued below my May 19th chart)...
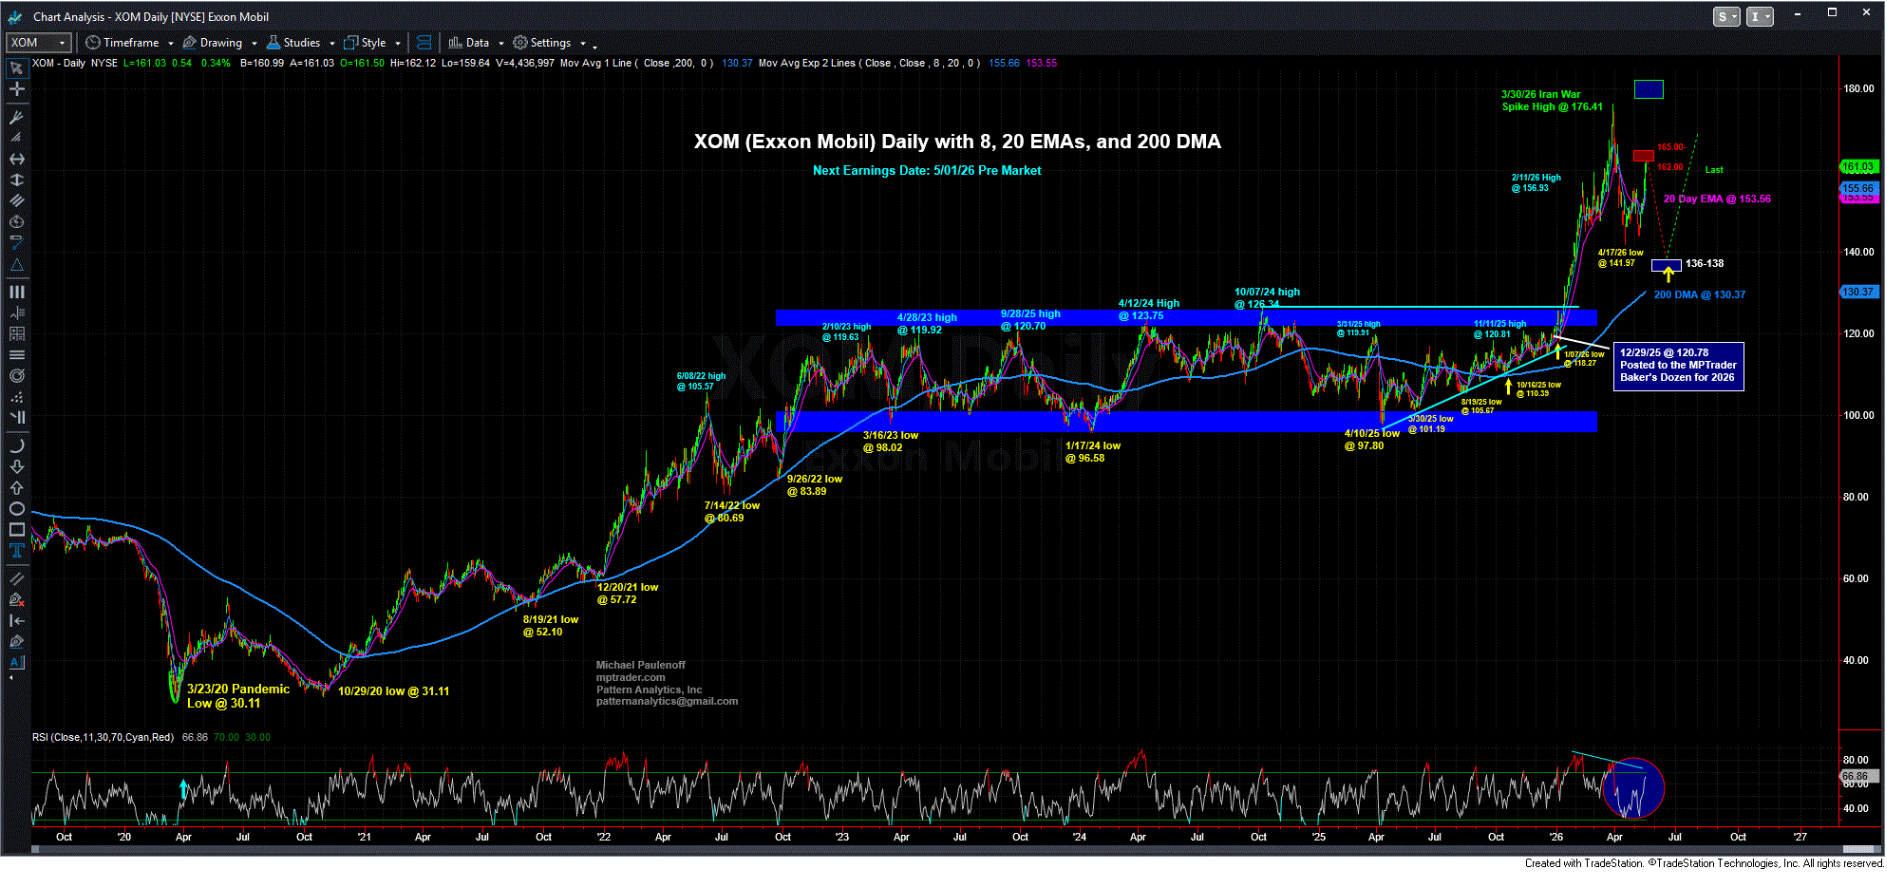
Fast-forward to this past Friday's close at 156.94, XOM is a full 16% above the 6/26/26 pivot low. This is what I discussed with MPTrader members in response to a member question:
Mike, do you expect a new all time high in this run?...
At the moment, all roads point to a challenge of key resistance from 163.70 to 166.30, where XOM could stall and pull back into the 150 area before my pattern work expects upside continuation toward a retest of the ATH at 176.41. That said, if Crude follows the projected price path I outlined in my earlier post, XOM will benefit from the tailwinds of $100+ Crude Oil, and as such, I will not be surprised if the current vertical upmove plows through resistance from 163.70 to 166.30, and keeps climbing to new ATHs... Last is 157.32...
My big picture pattern setup on the attached current Daily Chart argues strongly that XOM has unfinished business on the upside that will be reflective of Oil prices above $100/bbl (possibly to $125/bbl) for a sustainable period of time either during an extended conflict (a geopolitical price premium because of the ongoing logistical nightmare caused by the closure of the Strait of Hormuz), or, in the event of a peace deal, subsequent supply access issues and demand to refill nation's strategic petroleum reserves stubbornly-- if temporarily-- elevating oil prices.
Join us at MPTrader.com as our members and I navigate the rapidly shifting crosscurrents impacting the Oil markets, as well as individual stocks, ETFs, macro indices, sector ETFs, commodities, precious metals, and Bitcoin... MJP