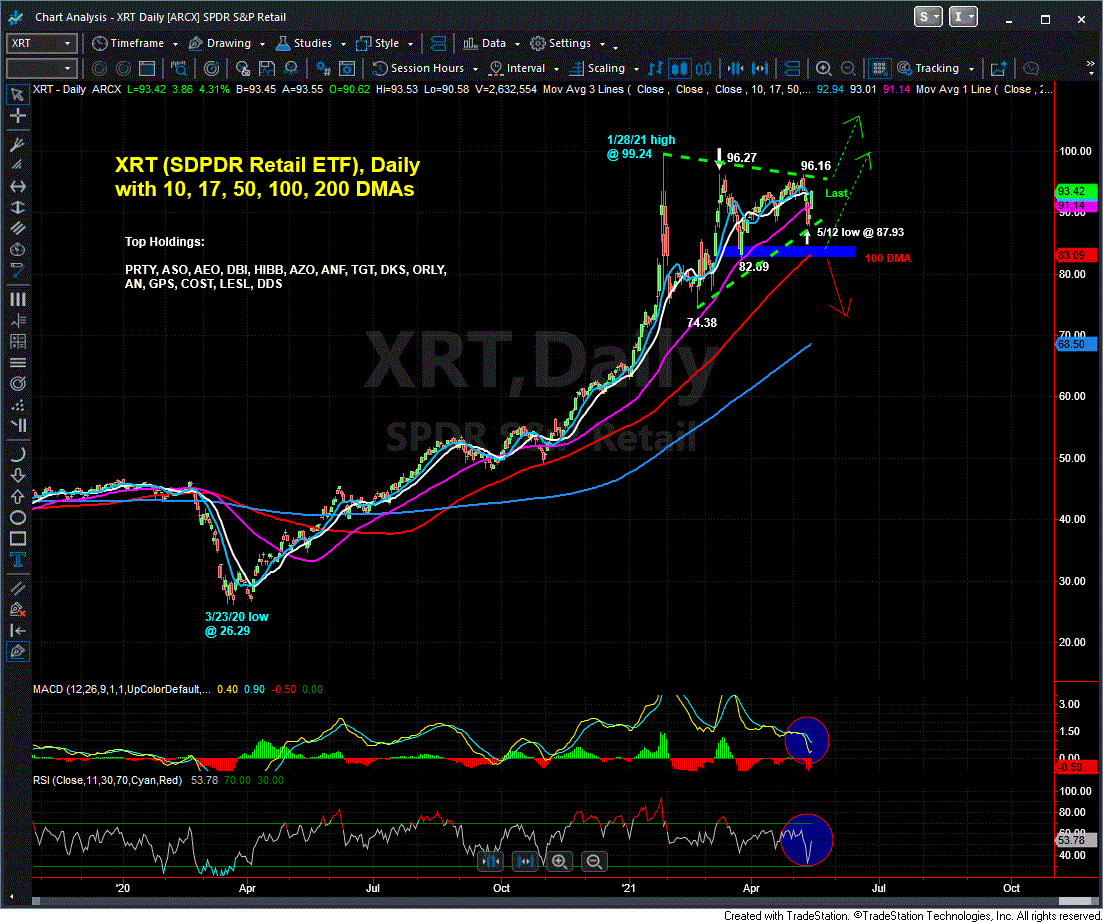
Getting Ahead Of Rally In Retail Sector ETF

by Mike Paulenoff
May 15, 2021 • 11:29 AM EDT
This past Friday, 30 minutes before the release of Retail Sales data for April, Mike Paulenoff posted his analysis of XRT, the SPDR S&P Retail Sector ETF.
After explaining in detail his analysis, which you can read here, Mike concluded: "All of the action from the Jan. 28th high at 99.24 through Tuesday's (May 12th) higher pullback low, represents a larger, bullish digestion period and pattern atop the dominant 15 month uptrend. In addition, based on my experience, the Coil type pattern that has been carved out has the requisite number of traverses across the contracting range to be considered complete or nearly complete, which if reasonably accurate, argues for the emergence of a new upleg in the XRT that propels the Retail ETF to new highs above 100, with an outlier upside target zone of 108 to 112."
XRT, trading at 89.56 at the time, proceeded to gap up to 90.60/65 at the open, despite a disappointing Retail Sales report. It clawed its way higher for all of Friday's session, closing at 93.42, a full 4.3% above its pre-market price at Mike's alert, and 3% above its up-gap opening price. This indicated strongly that the bullish pattern described by Mike in his early AM analysis to MPTader members was "calling the shots" for the XRT regardless of the apparent hiccup in April Retail Sales.
Where is XRT headed next? Based on Mike's analysis, XRT hasn't even broken out of its multi-month bullish digestion pattern yet.
Join Mike and our members in our MPTrader room as they analyze, discuss, and project the upcoming price action in XRT, as well as other names, ETFs, macro sector indices and futures, cryptos, commodities, and more.

Mike Paulenoff is the author of MPTrader.com, a real-time diary of his technical analysis & trade alerts on
ETFs for precious metals, energy, currencies, and an array of equity indices and sectors, including international
markets, plus key ETF component stocks in sectors like technology, mining, and banking.
Sign up for a Free 7-day Trial!
More Top Calls From Mike
In the early afternoon on April 11, this was my note to our members:"IBIT (iShares Bitcoin Trust ETF)-- From a trading perspective, anyone who is in sync with the Bitcoin setup might consider owning IBIT (iShares Bitcoin ETF) against a stop below its 4/07/25 low at 42.98 (see my attached Daily Chart below)...
Last Thursday (4/17/25) afternoon, ahead of NFLX (Netflix) post-close earnings report and the three-day Good Friday holiday weekend, we discussed the technical setup and whether or not the NFLX pattern was positioned to react positively to the news : The NFLX setup heading into Earnings later today is favorable for upside continuation above the prior two rally highs at 993.45 (4/15) and 998.70 (3/25), but not to a new ATH above 1064.
Last Thursday afternoon (4/10/25), the commentary below is what I discussed with MPTrader members about my Big Picture technical setup work: Tomorrow is the final session of the week. We get some big bank Earnings and PPI before the open, and more than likely, one or more POTUS televised events that undoubtedly will move markets one way or other. Technically, tomorrow's (Friday) close will be important to my Weekly Chart Work.
At the beginning of last week, fellow members Rayray and GordonGekko asked for my technical setup work on BX (Blackstone Inc). This is what we discussed on the morning of March 25, 2025:My attached Daily Chart shows the November 2024 to mid-March 2025 correction (-32%) followed by the recovery rally from 135.60 to 153.18.
On March 10, 2025, fifteen minutes before the closing bell and Oracle's forthcoming Earnings Report, below was the analysis I posted to the MPTrader Discussion Room about ORCL:"... My preferred scenario indicates a negative reaction to the news that sends ORCL reeling to test important support at 139.50-141.20-- where ORCL MUST reverse to the upside to avert triggering still lower projections into the 118-123 (back the truck up) target window... Last is 149.32"...

