100% Gain in 24 Hours

by Mike Paulenoff
April 8, 2016 • 12:00 AM EDT
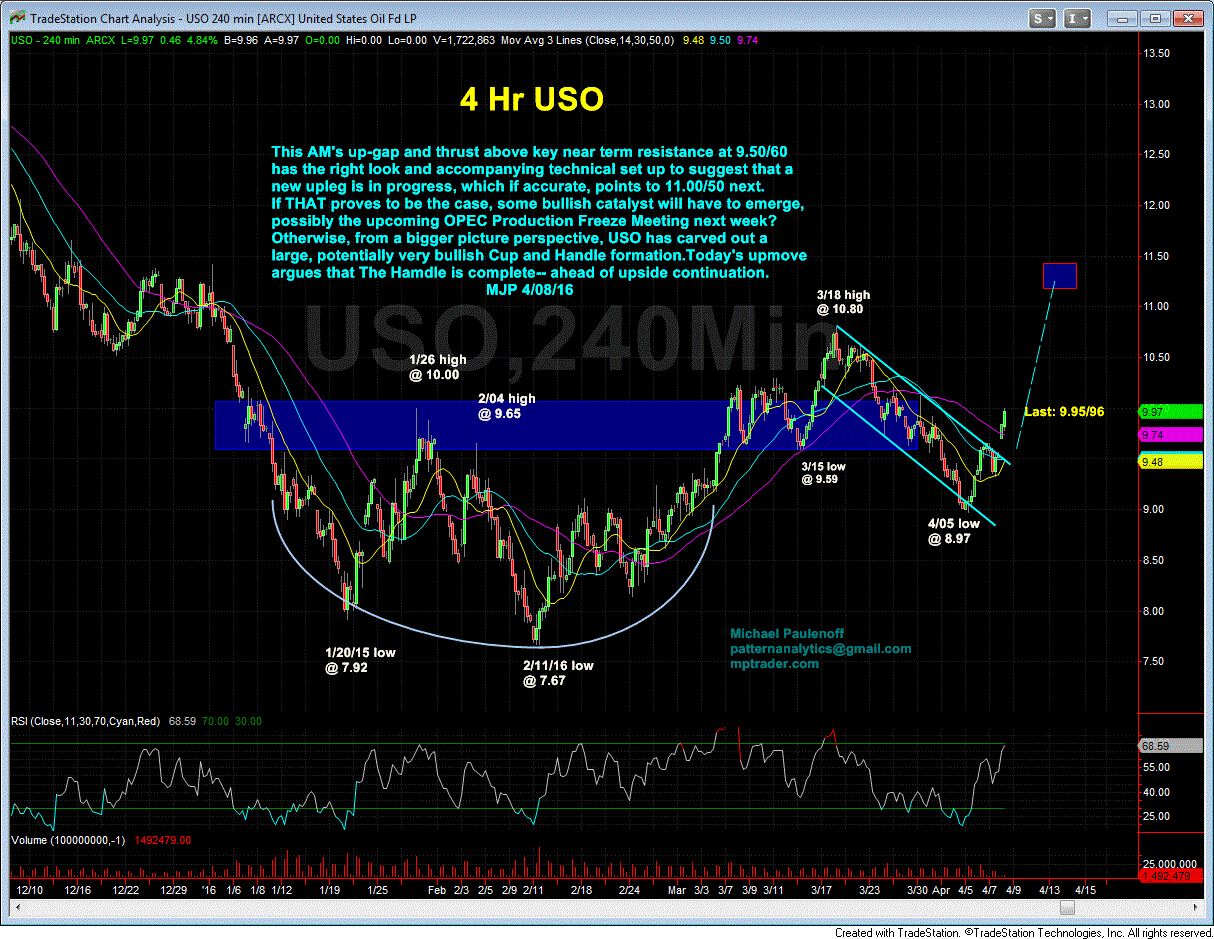
On Monday April 4, Mike noted in the room that the US Oil Fund ETF (USO) should hold key support at 9.25-9.00 given that its larger pattern represents an incomplete medium term recovery rally arguing for another up-leg towards 12.
On Tuesday, he got into the USO Apr. 8th 9.00 Calls at 27 cents, looking to take advantage of a technical bounce in the USO in reaction to Wednesday's EIA Oil Inventory Report.
Sure enough, the USO bottomed right at 8.99 on Tuesday, reaching above 10 intraday on Friday. Although Thursday's EIA Report would subsequently show a neutral/bearish weekly build in oil supplies, Mike's interpretation of the promising technical set up earlier in the week anticipated strong price action into, and a positive reaction after, the release of the data.
Mike exited the calls on Wednesday at 55 cents, for a 100% gain in 24 hours.
The USO trade was one of several strong trades for Mike since the start of the month. He exited the Silver Wheaton (SLW) puts on April 1 for a +200% gain in 1 day, and the SPDR S&P Biotech ETF (XBI) on April 6 for a gain of 10% in 2 weeks, displaying trading accuracy across a number of markets: Oil, Metals and Biotech.
Plus, Mike exited his Visa (V) and Raytheon Company (RTN) trades this week for 2% nominal gains, with only Nike (NKE) incurring a nominal loss after a 3.8% gain from a prior long position from March 14-18.
Mike Paulenoff is the author of MPTrader.com, a real-time diary of his technical analysis & trade alerts
on
ETFs for precious metals, energy, currencies, and an array of equity indices and sectors, including
international
markets, plus key ETF component stocks in sectors like technology, mining, and banking.
Sign up for a Free 7-day Trial!
More Top Calls From Mike
On January 2, 2026, this is what I posted about CAVA (Cava Group Casual Mediterranean Cuisine) to MPTrader members:After CAVA's meteoric climb from 29.00 in October 2023 to an ATH at 172.65 in November 2024, the stock rolled over into a relentless decline that hit its low at 43.
On the morning of April 9, 2026, this is what I posted about SMR (NuScale Power Corp) to our Discussion Room for MPTrader members:SMR (Nuscale Power Corp)-- Three views of this beleaguered, former high-flying modular nuclear power producer that has been in the grasp of a relentless six-month, 84% bear phase:-- From the perspective of my 4-hour Chart, SMR has the right look of nearing the completion of the downleg that started at the Jan. 2026 recovery rally high of 22.
On the morning of April 7, 2026, this is what I posted for MPTrader members about my interpretation of the near-term technical setup exhibited by META:My preferred technical scenario for META argues that the stock established a significant near-term low at 520.00 on 3/27/26 that resides within an August 2025 to March 2026, incomplete larger corrective process.
Thirty minutes after the opening bell on November 24, 2025, I posted the following heads-up to MPTrader members about the technical setup in META:META has the right technical look of a significant U-Turn to the upside after completing a 27% August-November correction from 796.25 (8/15/25) to 580.32 (11/21/25)... To gain more powerful upside traction, META needs to climb and sustain above nearest-term resistance at 614.70 to 616.50, which if (when) taken out, will open a higher price pathway to the 670 area to challenge the down-sloping 200 DMA... Last is 609.27...
Last Friday morning, to calm frazzled nerves amid a 1% pre-market plunge that was threatening to complete a 100% give back of the prior week's 3.