ACHR (Archer Aviation) Technical Setup Anticipates an Explosive Upmove

by Mike Paulenoff
December 1, 2024 • 2:10 PM EST
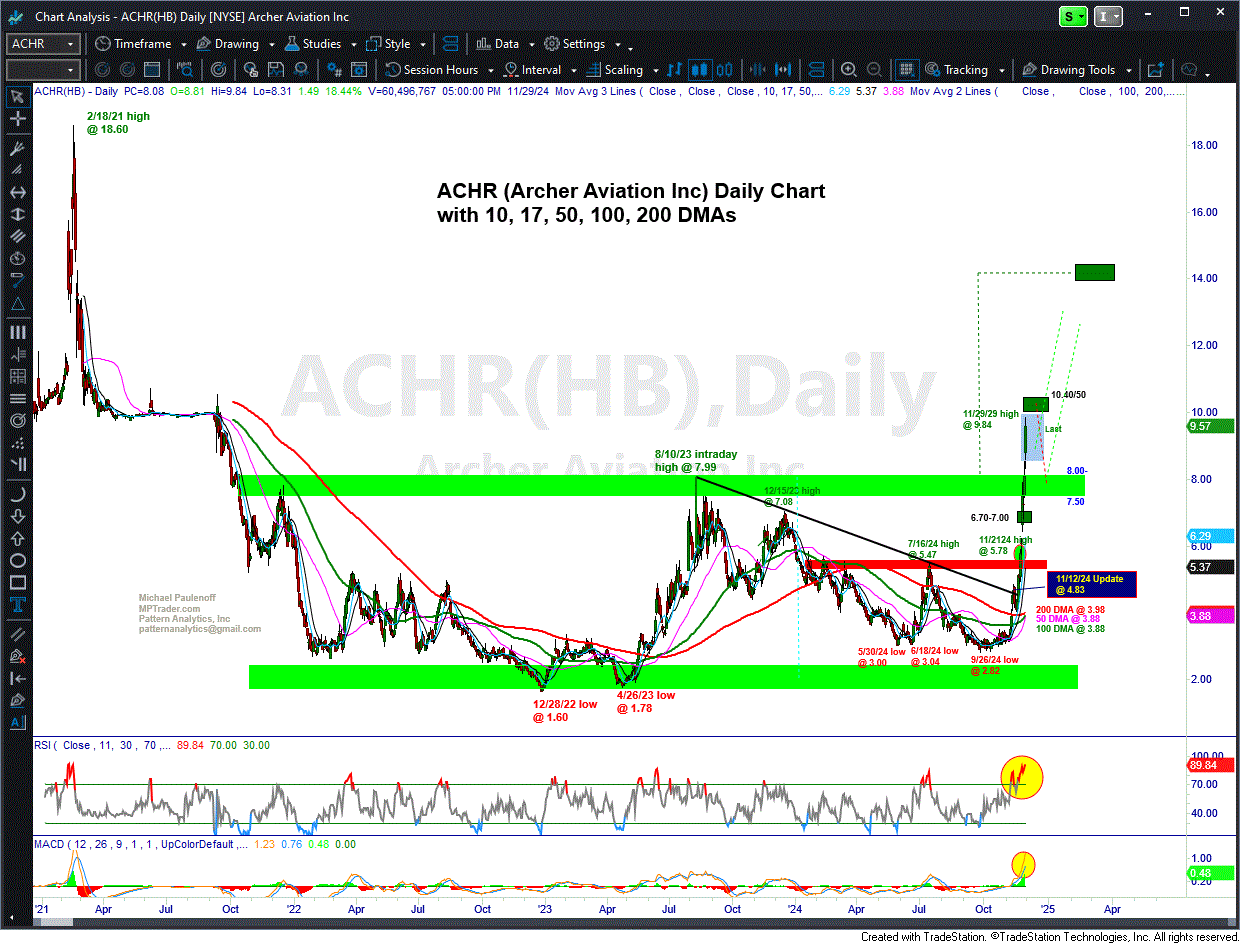
Back on November 12, 2024, fellow MPTrader member "Rayray" wrote the following when ARCH (Archer Aviation) was trading at $4.83:
Mike, as you may recall I have been an active follower of ACHR. I no longer have a position that I trade off of and am on the sidelines watching a move that I should have participated in . That said, is this the move to $9.00 that has been on the table for a while ?...
My analysis: NO!... ACHR has started a new bull phase that now has a higher target potential closer to 14.00 after it takes out 9.00!.. Fast-forward to today (11/29/24), we see ACHR has followed my technical script, exploding to the upside above an initial key resistance zone at 5.50/80 and this week, extending the vertical assault above a three-year resistance plateau at 7.50-8.00 that accelerated the advance to this AM's multi-year breakout high at 9.84. Now what? From a nearer-term perspective, ACHR points to an exhaustion target zone of 10.00 to 10.40, after which the price action EITHER will settle into a high-level digestion period (1-2 weeks) OR enter a correction that presses down to revisit the 7.50-8.00 breakout plateau ahead of another powerful upleg that projects closer to 14.00. My bias is for ACHR to enter a time-consuming high-level digestion period above 8.00 for 1 to 2 weeks to enable the 50 and 200 DMAs-- now at 3.87 and 3.98 respectively, to catch up to the rocketing price action. In other words, if I owned ACHR, I would be trading half the position, and holding the balance, looking to add back half the position into weakness into the 7.50-8.00 target window... Last is 9.13...
ACHR is a small-cap name in the concept field of eVTOL (Electric Vertical Takeoff and Landing vehicles), gaining some traction with forward-looking governmental agencies promoting clean emissions and reduced city traffic congestion. Although eVTOL could be viewed as something out of The Jetsons, for me, its explosively bullish intermediate-term chart setup captured our attention months ago, and, as so often occurs, anticipated the reasons and backstory justifying the vertical price assault ACHR investors have enjoyed during the second half of November 2024 (see my attached Daily Chart). ACHR rocketed from 4.83 on my 11/12/24 MPTrader update to last Friday's (11/29/24) high at 9.84, or +104%!
ARCH remains high on my radar screen into year-end and well into 2025...

Mike Paulenoff is the author of MPTrader.com, a real-time diary of his technical analysis & trade alerts on
ETFs for precious metals, energy, currencies, and an array of equity indices and sectors, including international
markets, plus key ETF component stocks in sectors like technology, mining, and banking.
Sign up for a Free 7-day Trial!
More Top Calls From Mike
Late on Friday, fellow MPTrader member MarkinQueens exclaimed: Mike's XOM (Exxon Mobil) chart from August is working! Last $117.26!Back on August 25th, this is what we discussed about Crude Oil and XOM:Just in case anyone is wondering what the chart of nearby Crude Oil is looking like as we approach the "official" end of summer.
On August 12, 2025, this was my response to an inquiry from an MPTrader member about intense weakness impacting SMR (NuScale Power Corp):SMR (NuScale Power)-- Fellow member Irv66 asked for an update on this modular nuclear reactor manufacturer that blasted-off from 11.08 in early April to 53.50 at the end of July (+382%), but has since been in the grasp of a major correction from 53.50 to 38.33 (-28.6%). My pattern work argues that SMR is nearing key support from 37.50 down to 33.
ARKK (ARK Innovation Fund, ETF)-- Back on August 20, 2025, this is what we discussed about ARKK:Fellow member Pawel has requested an update on Cathie Wood's fund, which in June thrust up and out of a 3-1/2 year base-accumulation period and pattern above 68.40/50 that subsequently climbed to my initial target in the vicinity of 80 (see my attached Daily Chart). Since the 7/21/25 high at 79.
On July 31, 2025, with SLV (Silver ETF) trading at 33.27, this is what we discussed about my technical setup:SLV-- On the subject of tariffs, copper, and silver, Trump extended the tariff deal with Mexico for 90 days, which included steel and copper, but NO MENTION of Silver (so far). Let's notice on my attached 4-Hour chart of SLV that the week-long nosedive from 35.91 to this AM's low at 33.
On February 18, 2025, this is what I posted on MPTrader about KWEB (Chinese Internet ETF) that alerted traders to a potentially explosive setup that should keep KWEB on our radar screens going forward :My attached Daily Chart shows that KWEB is attempting to emerge from a huge, three-year rounded base-accumulation setup that projects much higher prices as the price structure climbs the "recovery wall of worry" in the aftermath of the relentless bear phase from the February 2021 ATH at 104.