AMD Follows Our Bullish Technical Script

by Mike Paulenoff
July 16, 2023 • 11:31 AM EDT
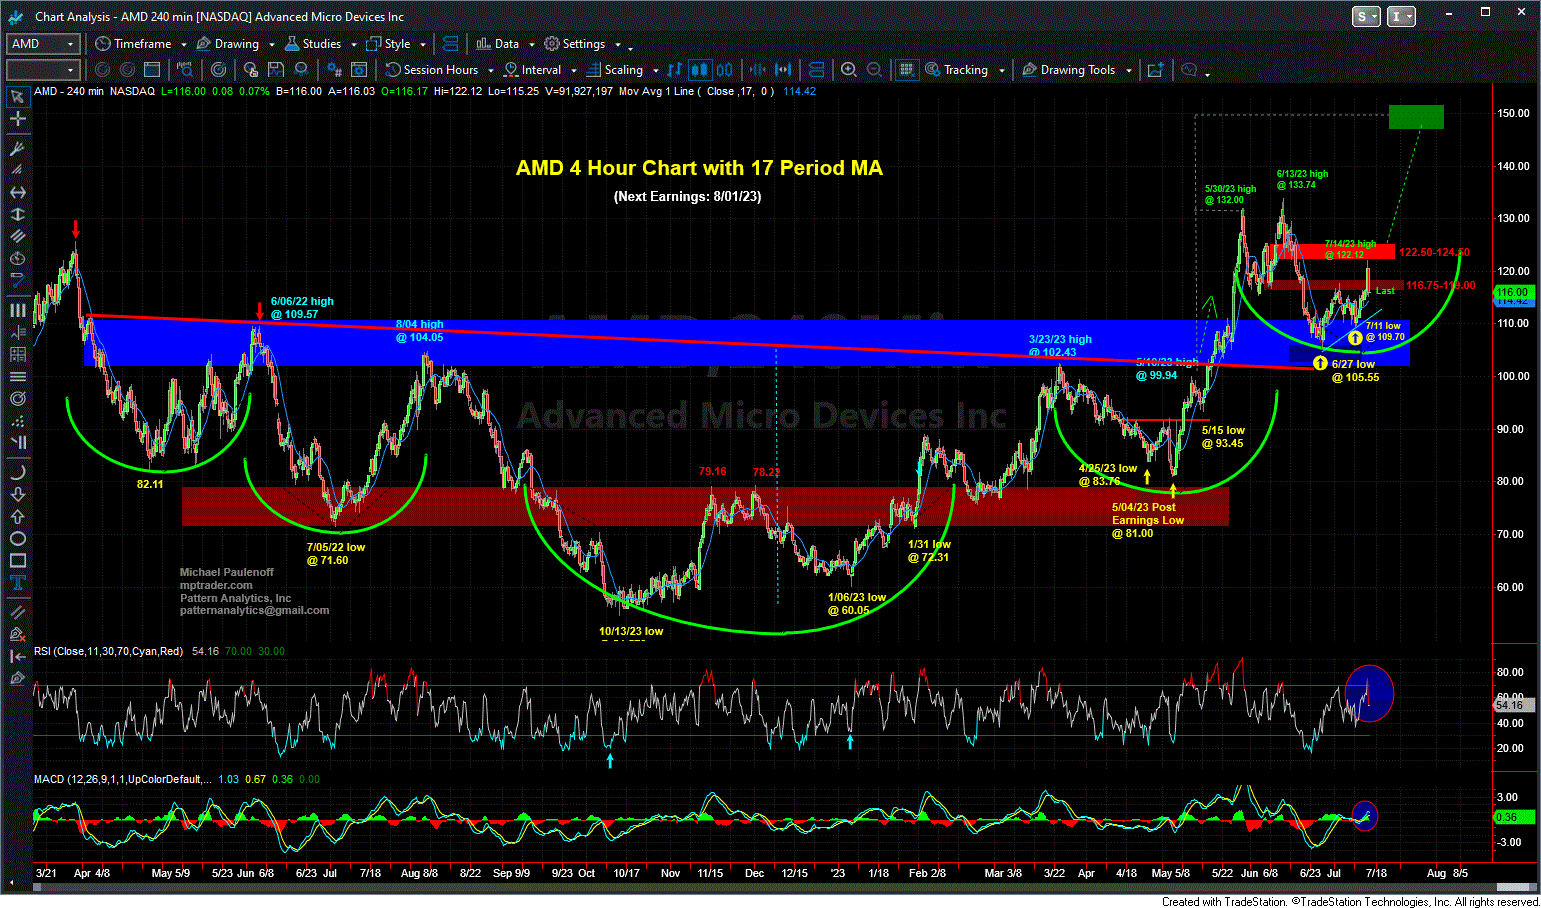
On June 23rd, Mike Paulenoff posted a "heads-up" commentary about AMD for MPTrader members:
"AMD Bottom Line: While my near-term pattern work cannot rule out one more new pullback low in the vicinity of 102-105 to complete the correction off of the 133.74 high on 6/13, the 20% decline is very near completion ahead of another upleg that should propel AMD to my next optimal target zone derived from the upside breakout from the huge multi-month base-accumulation period that projects next to 148-152... Last is 110.26..."
Mike continued to guide members through multiple AMD updates, and on July 10th wrote:
"In the next book I write about technical analysis, I will use my attached 4-Hour Chart as an example of a textbook Inverse Head & Shoulders formation... that remains incomplete on the upside... as long as any forthcoming weakness is contained above the 6/27/23 pullback low at 105.55.
"To trigger upside traction, AMD needs to climb and sustain above 117.65/70. At the moment, although my nearest-term work is bullish above 105.55, as long as AMD is trading below 117.65/70 I cannot rule out a retest of the June low-zone prior to my expectation of the initiation of a new, powerful upleg... Last is 113.01..."
Then last Friday, July 14th, Mike again alerted MPTraders to the price action in AMD:
"AMD is following our bullish technical script as it accelerates to the upside after completing a meaningful pullback to its multi-month upside breakout zone (see my attached Chart)... Last is 119.82..."
AMD hit an intraday high at 122.12, a full 10.8% above Mike's June 23rd post to MPTrader members, and 15.7% above the major corrective low of 105.55 established on June 27th. After hitting the 122.12 high -- just beneath Mike's second key near-term resistance zone as shown on the chart -- AMD gave up most of its intraday gains (5%) late in Friday's session.
Is the up-move over? What's next for AMD?
Join Mike and MPTrader members for Mike's ongoing granular analysis and discussion of AMD, as well as many other individual stocks, ETFs, Macro Indices, Foreign Exchange, Commodities, and Bitcoin as investors and traders enter a new earnings period ahead of a late-July FOMC meeting.
On July 31, 2025, with SLV (Silver ETF) trading at 33.27, this is what we discussed about my technical setup:SLV-- On the subject of tariffs, copper, and silver, Trump extended the tariff deal with Mexico for 90 days, which included steel and copper, but NO MENTION of Silver (so far). Let's notice on my attached 4-Hour chart of SLV that the week-long nosedive from 35.91 to this AM's low at 33.
On February 18, 2025, this is what I posted on MPTrader about KWEB (Chinese Internet ETF) that alerted traders to a potentially explosive setup that should keep KWEB on our radar screens going forward :My attached Daily Chart shows that KWEB is attempting to emerge from a huge, three-year rounded base-accumulation setup that projects much higher prices as the price structure climbs the "recovery wall of worry" in the aftermath of the relentless bear phase from the February 2021 ATH at 104.
On July 29, 2025, this is what we discussed about TEVA (Teva Pharma), accompanied by my then-current 4-Hour Chart, just ahead of Earnings:My attached 4-Hour Chart setup argues that TEVA is poised for upside continuation of its April-May advance (12.47 to 18.67) EITHER right from current levels in reaction to a positive Earnings Report tomorrow morning, OR into a BTD bout of weakness into the 14.85-15.55 target support window.
On the morning of August 6th, I posted the chart below after seeing Fundstrat's Tom Lee discuss his CEO position in BMNR (BitMine Immersion Technologies), and the fact that BMNR was accumulating a large cache of Ethereum (ETH) that will serve as an ETH Treasury holding similar to the Bitcoin model used by Microstrategy's Michael Saylor. At the time, BNMR had climbed from 31.85 to 33.70, which piqued my attention technically:"BNMR ... once again is putting upward pressure on the 34.
Nearly two months ago, I posted my technical setup on TMO (Thermo Fisher Scientific, Inc.) to alert MPTrader members to a potentially significant upside reversal pattern. Here is my commentary from June 3, 2025:My attached Big Picture Daily Chart shows the major bear phase from the 9/10/24 ATH at 627.88 to last week's (5/23/25) low at 390.66 (-38%). Most interestingly, all of the price action from the 4/09/25 low at 409.