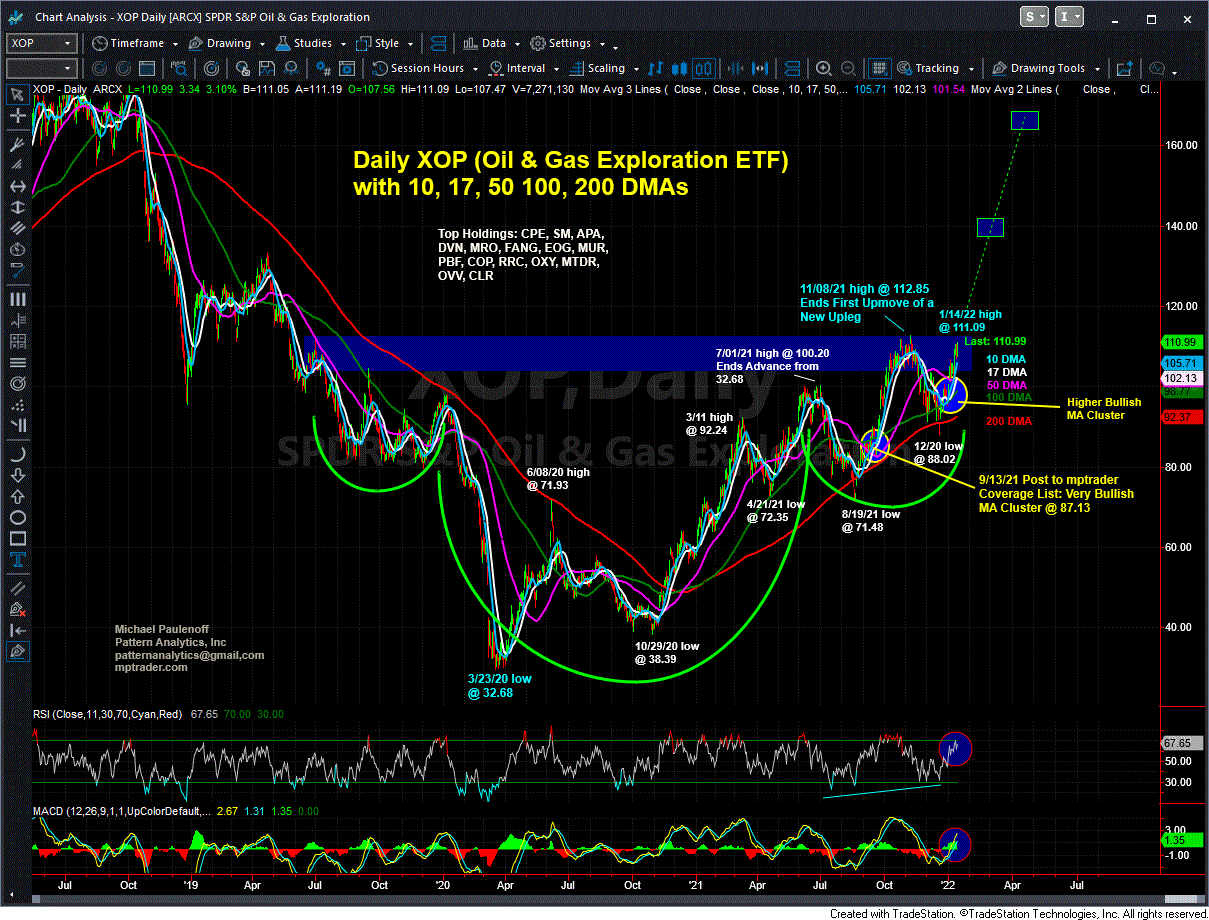
After Calling XOP's 30% Climb ... What's Next?
It all started back on September 13, 2021, with a potentially bullish technical signal in Mike Paulenoff's work on XOP (SPDR S&P Oil & Gas Exploration ETF). Mike explained to MPTader members:
"I am not sure what the backstory is on this potentially very bullish technical setup (inflation, delivery problems, confrontation in the OPEC producing states, frigid winter in the US and Europe?), but one look at my attached Big Picture Chart suggests strongly that XOP has been under accumulation for nearly 2 years, 3 months, and has carved out a large inverse Head and Shoulders Bottom... From a nearer-term perspective, XOP today is trading above ALL of my near and intermediate-term MAs, which are clustered together in a relatively tight area beneath the price structure, 'threatening' to propel XOP to the upside towards a confrontation with multi-year resistance at 98 to 100... if taken out, will trigger MUCH HIGHER PROJECTIONS for XOP."
Mike added later that afternoon: "Isn't ironic that the Oil sector could be on the verge of a powerful upside acceleration when the global push for clean everything is being ratcheted up more than ever before? The fact of the matter is that it could take at least 10 years to shift away from fossil fuel, which leaves plenty of time for traditional energy prices to skyrocket both from a supply-demand perspective, and from an inflation-expectation perspective as well."
From Mike's mid-September technical alert, XOP rocketed from its then-price of 87.13 to a 2-1/2 year high at 112.85 on November 8, a vertical climb of nearly 30%, prior to a pullback to test support in the vicinity of the 200 DMA.
Mike posted multiple updates along the way, tracking Crude Oil futures, Natural Gas futures, XOP, XLE, and SWN for our members.
On November 29, he commented:"My vehicle of choice to participate in this next upleg is XOP (SPDR Oil and Gas Exploration ETF), which I have attached below, and which also has the right look of a completed correction from its 11/08 high at 112.85 to last Fri's (11/26) low at 95.56 (-15%). If my multi-month pattern and momentum work prove reasonably accurate, then XOP is starting a trek to new highs above 112.85 to 130-132, in route to 140-143."
As it turned out, XOP dipped one more time to an 88.02 low on December 21 prior to pivoting into a new vertical after holding above the 200 DMA on a closing basis. It has since climbed 26% to revisit its early November high at 112.85.
What's next for Oil and for XOP? Join Mike and our members for ongoing, intraday discussions about technical setups as well as supportive or unsupportive background inputs in Oil, Oil equities, Oil ETFs, as well as numerous other individual names, ETFs, macro indices, cryptocurrencies, Commodities, and more.

