Anticipating CRM's Sell-Off

by Mike Paulenoff
December 5, 2020 • 12:00 AM EST
After Salesforce.com (CRM)'s earnings report late Tuesday, Mike Paulenoff cautioned MPTrader members about the stock, noting:
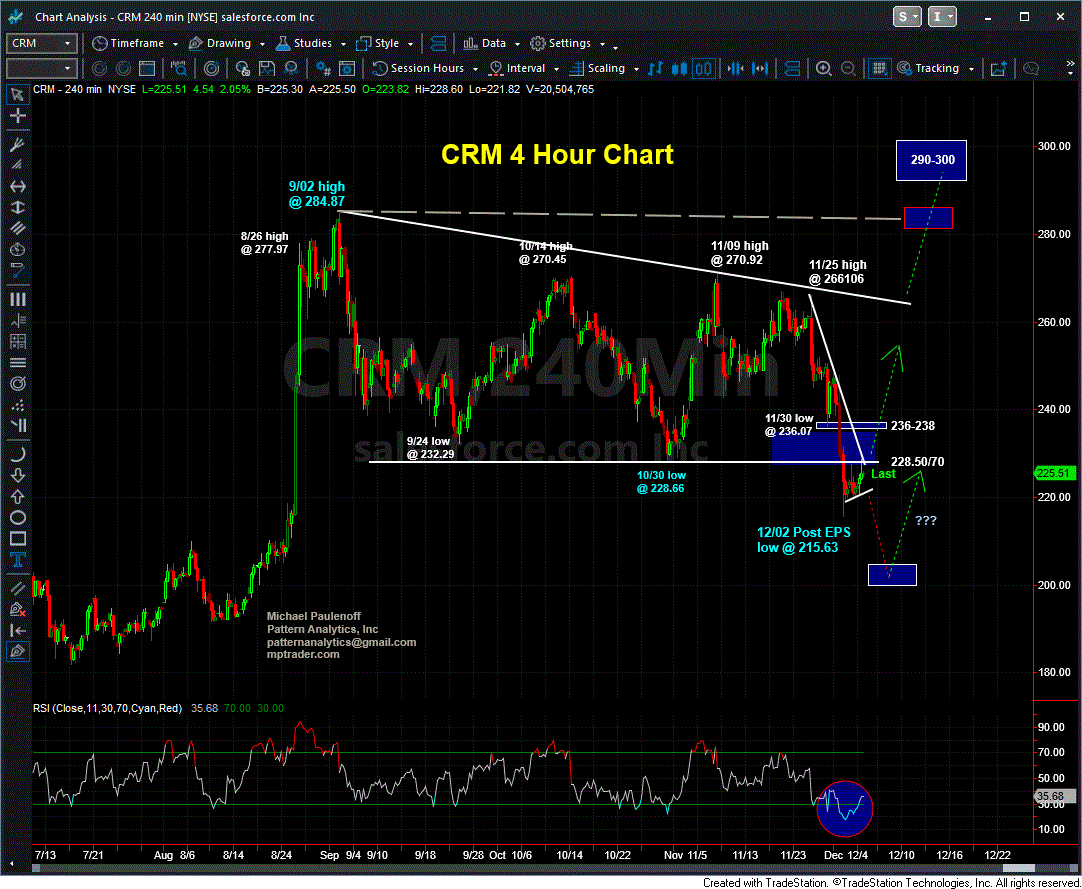
"CRM beat The Street on Earnings, Revenues, and Raised Guidance, BUT... confirmed buying Slack (WORK) for $27.7 Billion, which continues to give some investors a bit of indigestion. CRM is 4% lower from the 4 PM ET close, pressing down to 230.60, which we see on my attached chart is nearing a full-fledged test of the technically critical 10/30 low at 228.66. The 10/30 low MUST contain any additional weakness to avert triggering a long liquidation event that sends CRM towards 200-190 next."
The stock, which was at 232.75 at the time, went on to break that critical 10/30 pivot low the very next morning -- which, just as Mike had warned, triggered long liquidation that spiked the stock through Mike's next immediate downside target of 220 to a post-earnings low of 215.63.
Mike continued to monitor the stock closely for MPTrader members through the remainder of the week, as CRM attempted to rally above 228-229 but failed to sustain the strength, closing the week at 225.51.
Where to next for CRM?
Join Mike and his MPTrader community in our Member's Room to closely monitor CRM's price behavior next week for a potential bullish technical signal.
Mike Paulenoff is the author of MPTrader.com, a real-time diary of his technical analysis & trade alerts
on
ETFs for precious metals, energy, currencies, and an array of equity indices and sectors, including
international
markets, plus key ETF component stocks in sectors like technology, mining, and banking.
Sign up for a Free 7-day Trial!
More Top Calls From Mike
Thirty minutes after the opening bell on November 24, 2025, I posted the following heads-up to MPTrader members about the technical setup in META:META has the right technical look of a significant U-Turn to the upside after completing a 27% August-November correction from 796.25 (8/15/25) to 580.32 (11/21/25)... To gain more powerful upside traction, META needs to climb and sustain above nearest-term resistance at 614.70 to 616.50, which if (when) taken out, will open a higher price pathway to the 670 area to challenge the down-sloping 200 DMA... Last is 609.27...
Last Friday morning, to calm frazzled nerves amid a 1% pre-market plunge that was threatening to complete a 100% give back of the prior week's 3.
Late on Friday, fellow MPTrader member MarkinQueens exclaimed: Mike's XOM (Exxon Mobil) chart from August is working! Last $117.26!Back on August 25th, this is what we discussed about Crude Oil and XOM:Just in case anyone is wondering what the chart of nearby Crude Oil is looking like as we approach the "official" end of summer.
On August 12, 2025, this was my response to an inquiry from an MPTrader member about intense weakness impacting SMR (NuScale Power Corp):SMR (NuScale Power)-- Fellow member Irv66 asked for an update on this modular nuclear reactor manufacturer that blasted-off from 11.08 in early April to 53.50 at the end of July (+382%), but has since been in the grasp of a major correction from 53.50 to 38.33 (-28.6%). My pattern work argues that SMR is nearing key support from 37.50 down to 33.
ARKK (ARK Innovation Fund, ETF)-- Back on August 20, 2025, this is what we discussed about ARKK:Fellow member Pawel has requested an update on Cathie Wood's fund, which in June thrust up and out of a 3-1/2 year base-accumulation period and pattern above 68.40/50 that subsequently climbed to my initial target in the vicinity of 80 (see my attached Daily Chart). Since the 7/21/25 high at 79.