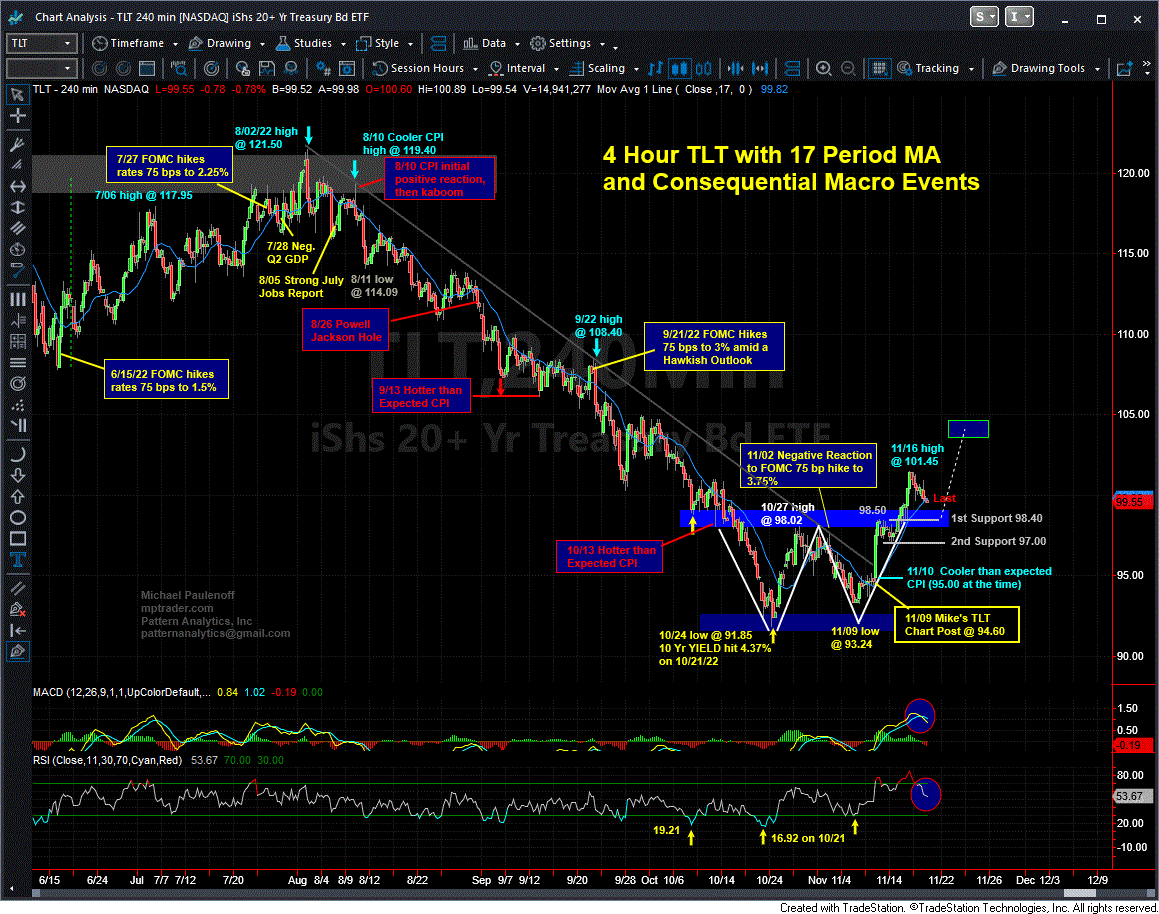
Anticipating TLT Thrust On CPI Data
On Wed Nov 9, the day before the next consequential CPI (inflation) report, Mike Paulenoff posted the following bullish analysis of the TLT (20+ Year T-bond ETF) for MPTrader members, writing:
If my attached 4 Hour TLT (20+ Year T-bond ETF) Chart Setup is whispering anything to us about the next likely near-term directional price surge, then all of the action since mid-October has carved out an accumulation pattern in the form of a big "W" that has the potential to trigger a sharp rapid advance towards 104-105.
Of course, tomorrow's CPI data is the next catalyst that can trigger a thrust above a key August-November down trendline that cuts across the price axis in the vicinity of 95.95, and if taken out and sustained, will point TLT directly to 98.00 where the Big Double Bottom will challenge a 4-week resistance-upside breakout zone... Last is 94.60...
As fate would have it, Mike's interpretation of the TLT technical setup proved prescient and valuable to MPTrader members. The CPI report for October came in cooler than expected, which triggered a violent upside thrust in the price of TLTs from 94.60 to 98.50 (+3.6%).
During the powerful upside market reaction, Mike posted a follow-up chart, noting:
... TLT is trading at 97.80, as it completes the "Right Side" of the Double Bottom formation that will put increasing upward pressure on key resistance at 98.00, if taken out and sustained, will trigger projections to 104-105 next... Last is 97.84...
Fast-forward to last Wednesday morning (11/16), TLT rocketed above 98 to a 5-week high at 101.45, prompting Mike to write:
Isn't it a little odd that Retail Sales for October were stronger-than-expected, but TLTs are UP? My only thought is that TLT is following the lead of TGT's (Target Inc) earnings miss and lower (holiday) Q4 guidance message this AM, which is a forward-looking perspective that the bond market can embrace more readily than last month's Retail Sales data. Be that as it may, let's notice on my attached 4 Hour Chart of TLT that today's strength has propelled the price structure above 100 for the first time since October 14, but more importantly from a technical perspective is that the strength has completed the five-week "W" or Double Bottom formation, and as such, triggers higher projections to 103 to 105 next... Last is 100.04...
Although next week is a short one because of Thursday's Thanksgiving Holiday, some notable retailer earnings are scheduled for Monday and Tuesday, and a slew of economic data is due out on Wednesday that could produce the next consequential directional catalyst for bond prices, TLTs, and longer-term interest rates.
Durable Goods, Jobless Claims, Michigan Sentiment Surveys, and the Minutes from the November 2nd FOMC meeting certainly have the potential to impact markets.
Join Mike and MPTrader members this week for their ongoing intraday discussions about opportunistic setups in the TLTs as well as many other macro and sector market ETFs, individual stocks, equity futures indices, currencies, commodities, and Bitcoin.

