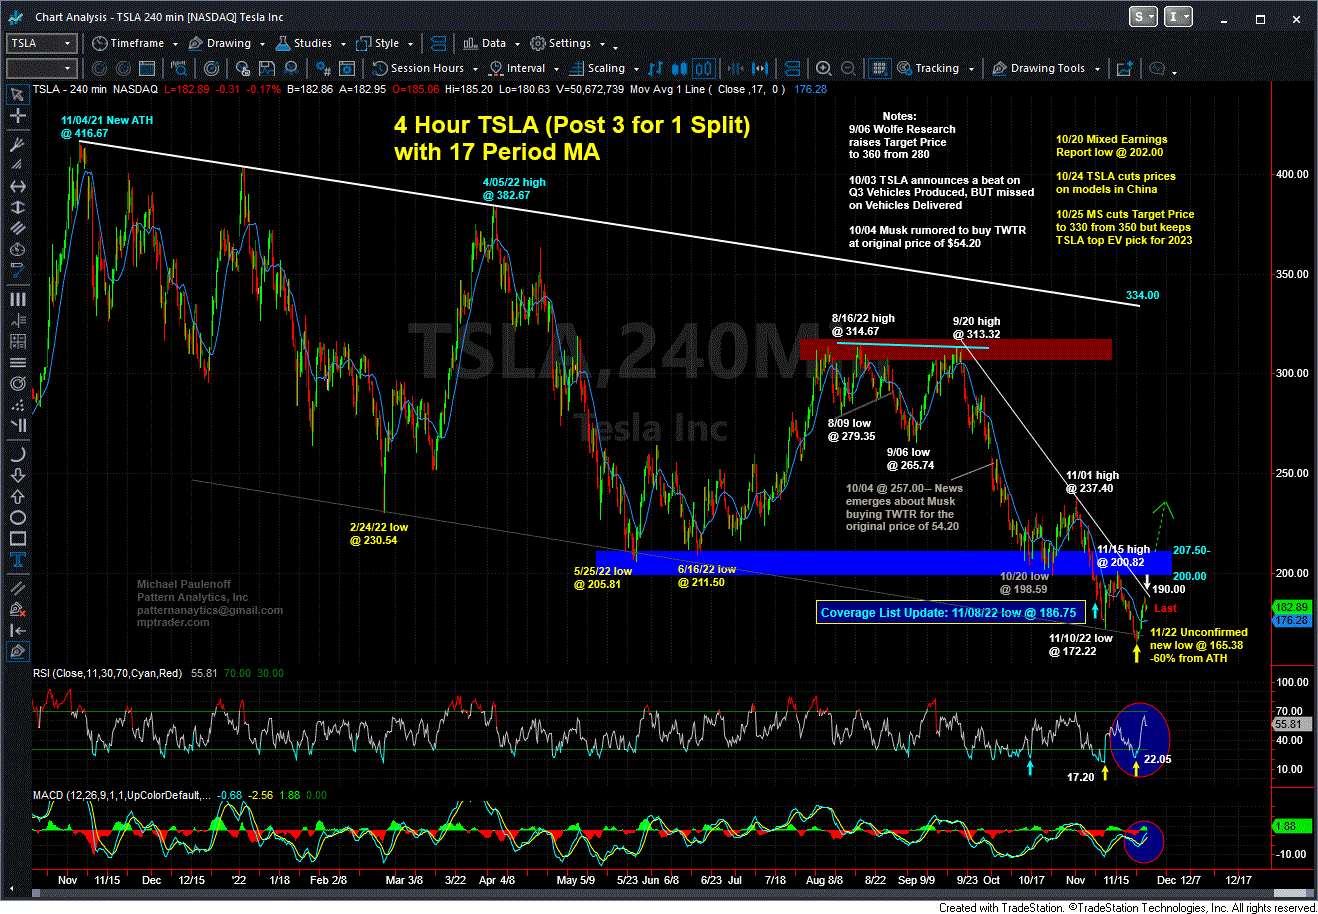
Anticipating TSLA's Downside Exhaustion & Upside Reversal
On November 8, just after TSLA (Tesla Inc) traded down a new multi-month corrective low at 185.75, Mike Paulenoff posted the following analysis to the MPTrader member discussion room:
TSLA is getting closer to BOTH my next optimal downside target zone of 170-175 AND a condition of downside exhaustion within the downleg from the 8/16 high at 314.67.
Bottom Line: As of this moment, TSLA's plunge today to a new big picture corrective low at 186.75 is CONFIRMED by my 4 Hour Momentum gauges which warns us that it still has unfinished business on the downside prior to embarking on a sustainable advance. My sense at the moment is that TSLA will remain beneath resistance starting at 201, and as such, is vulnerable to rolling over into a final decline that violates 186.75 in route to 175 (down to 170), from where I will be looking for exhaustion and an upside reversal signal... last is 192.82.
Fast-forward past several follow-up TSLA analytic updates to Mike's Nov 23 chart post, where TSLA finally started showing signs of downside exhaustion:
Yesterday's new multi-month corrective low at 165.38 was UNCONFIRMED by my 4 Hour Momentum gauge, which is a major warning signal that TSLA's most recent downleg from the 8/16 high at 314.67 is exhausted on the downside and as such, is positioned for a sharp upside reversal. The fact that both Citigroup and Wedbush Securities posted positive notes this AM about TSLA with targets of 176 and 250 suggests strongly that 1) downside is very limited from current levels according to Citigroup, and 2) upside could be substantial according to Wedbush. From a more immediate perspective, as long as the 165.38 low contains any forthcoming weakness, TSLA points to the 193 area initially for a challenge of its Sep-Nov. down trendline... last is 178.91.
After Mike's Nov 23 technical heads-up to MPTrader members, TSLA has climbed 14% from the Nov 22 multi-month low to Friday's (Nov 25) intraday high at 188.50, in route to putting pressure on key resistance along the September-November down trendline, now in the vicinity of 190.00.
Based on Mike's nearest-term pattern work, TSLA's rally from 165.38 to 188.50 exhibits bullish form and as such, argues strongly for upside continuation. Join Mike and MPTrader members for their intraday discussions about TSLA's forthcoming price trajectory, as well as for their opportunistic analysis of many other individual stocks, ETFs, macro indices, commodities, precious metals, oil, and Bitcoin.

