Anticipating The Powerful Advance In Gilead Sciences (GILD)

by Mike Paulenoff
October 30, 2022 • 4:32 PM EDT
Back on August 29, Mike Paulenoff alerted MPTrader members to his excitement about the potential for a powerful advance in Gilead Sciences (GILD), writing:
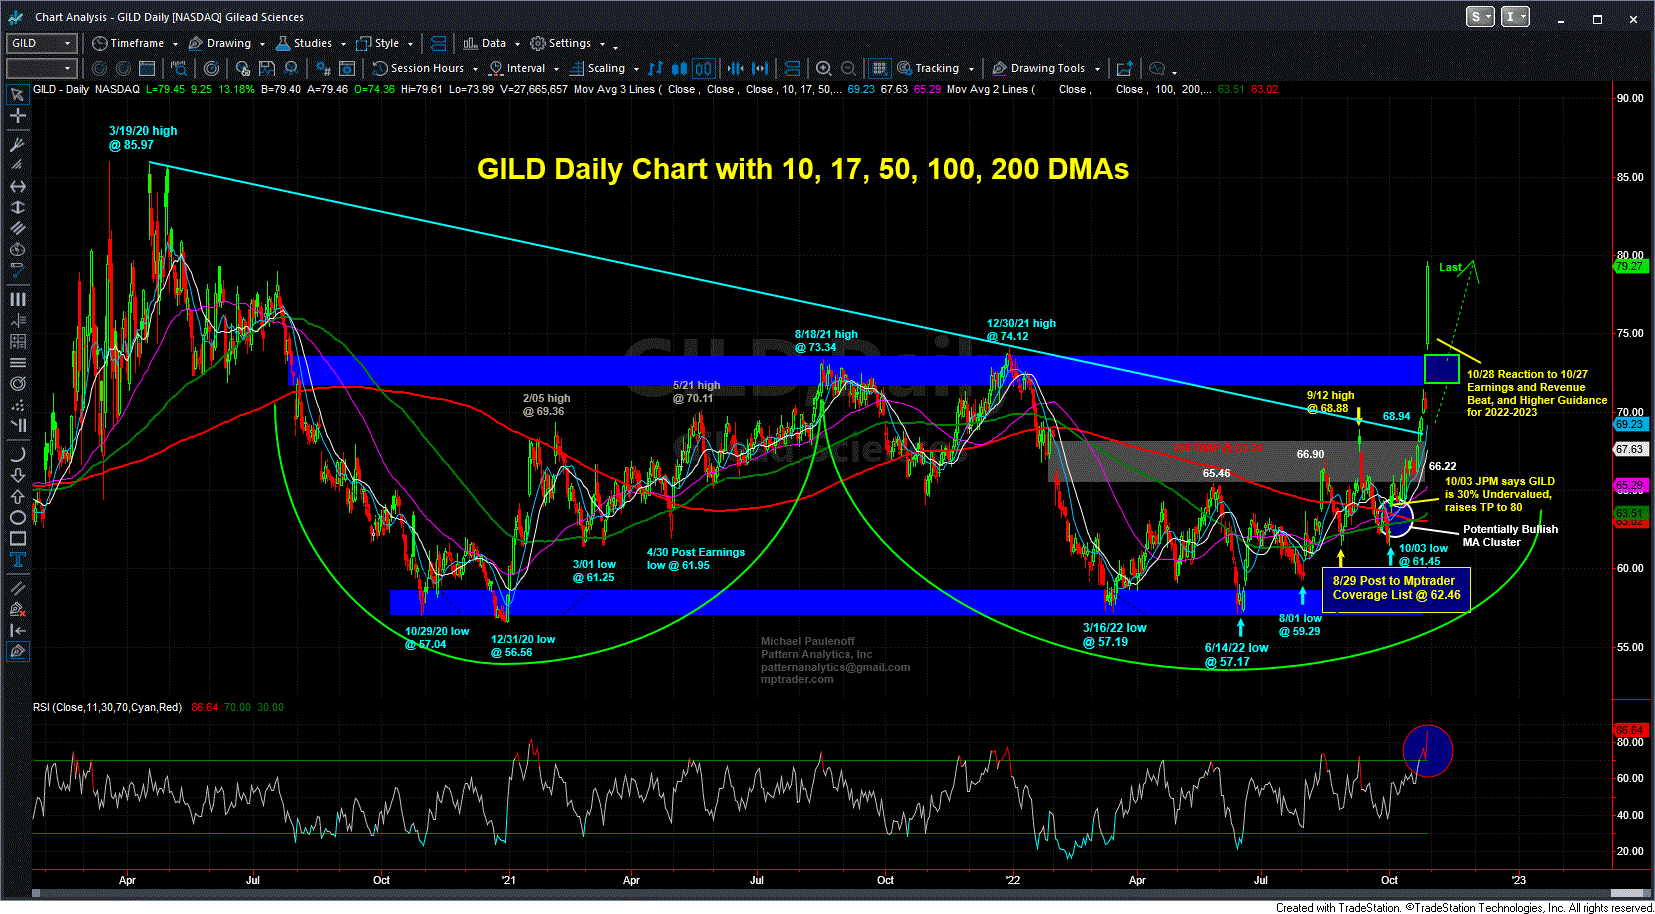
For two years, GILD has been traversing a wide (24%) range between 57-59 on the low side and 70-72 on the high side (see my attached Daily Chart). Every time GILD sinks into the vicinity of 60, it becomes relatively cheap within the range (57 stop) ahead of a traverse towards 70-72... If you are a VERY PATIENT investor who does not mind tying up money for an extended period of time, then you are risking a close under 56.50 to "be there" for the run to and above 69.00-70.00, and thereafter, towards a challenge of the upper boundary zone from 83 to 87, where GILD either will rocket into a new bull leg, or fail miserably.
My sense from the very BIG picture structural setup since 2010 is that since 2017 GILD has been biding time ahead of a forthcoming VERY BULLISH direction price catalyst (or catalysts) that will propel the stock out of its rangebound funk... Last is 62.56.
Fast-forward to last week in which indeed a catalyst unleashed GILD's bullish potential. It turned out to be a Q3 Earnings Report that far exceeded Wall Street's expectations, and as such, triggered an extremely positive investor reaction that propelled the stock above a 2-1/2 year resistance plateau from 72 to 74, toward Mikes intermediate-term target zone of 83 to 87.
GILD closed at 79.27 on Friday, a full 27% above its price when Mike first alerted MPTrader members on August 29.
What's next for GILD and other names and ETFs in the Biotech and Healthcare space? Join Mike and MPTrader members for their constant intraday market discussions about individual stocks, ETFs, Macro Indices, Commodities, Crypto, and much more, especially during the forthcoming consequential Fed Week!
Mike Paulenoff is the author of MPTrader.com, a real-time diary of his technical analysis & trade alerts
on
ETFs for precious metals, energy, currencies, and an array of equity indices and sectors, including
international
markets, plus key ETF component stocks in sectors like technology, mining, and banking.
Sign up for a Free 7-day Trial!
More Top Calls From Mike
Pharma Update: MRK and LLYOn Wednesday (6/24/26), this is what we discussed about MRK:MRK as well, which we see on my attached Daily Chart exhbits a VERY BULLISH technical setup-- quite the opposite of beleaguered PFE. My pattern work argues that all of the price action from the 2/25/26 high at 125.14 represents a high-level bullish digestion period and pattern atop the major upleg from the May 2025 low at 73.31.
On January 2, 2026, this is what I posted about CAVA (Cava Group Casual Mediterranean Cuisine) to MPTrader members:After CAVA's meteoric climb from 29.00 in October 2023 to an ATH at 172.65 in November 2024, the stock rolled over into a relentless decline that hit its low at 43.
On the morning of April 9, 2026, this is what I posted about SMR (NuScale Power Corp) to our Discussion Room for MPTrader members:SMR (Nuscale Power Corp)-- Three views of this beleaguered, former high-flying modular nuclear power producer that has been in the grasp of a relentless six-month, 84% bear phase:-- From the perspective of my 4-hour Chart, SMR has the right look of nearing the completion of the downleg that started at the Jan. 2026 recovery rally high of 22.
On the morning of April 7, 2026, this is what I posted for MPTrader members about my interpretation of the near-term technical setup exhibited by META:My preferred technical scenario for META argues that the stock established a significant near-term low at 520.00 on 3/27/26 that resides within an August 2025 to March 2026, incomplete larger corrective process.
Thirty minutes after the opening bell on November 24, 2025, I posted the following heads-up to MPTrader members about the technical setup in META:META has the right technical look of a significant U-Turn to the upside after completing a 27% August-November correction from 796.25 (8/15/25) to 580.32 (11/21/25)... To gain more powerful upside traction, META needs to climb and sustain above nearest-term resistance at 614.70 to 616.50, which if (when) taken out, will open a higher price pathway to the 670 area to challenge the down-sloping 200 DMA... Last is 609.27...