Anticipating The Up-Move In EWJ

by Mike Paulenoff
May 21, 2023 • 1:51 PM EDT
Just after the start of the New Year, on January 9, Mike Paulenoff posted the following missive to MPTrader members about EWJ (Japanese Country Fund ETF):
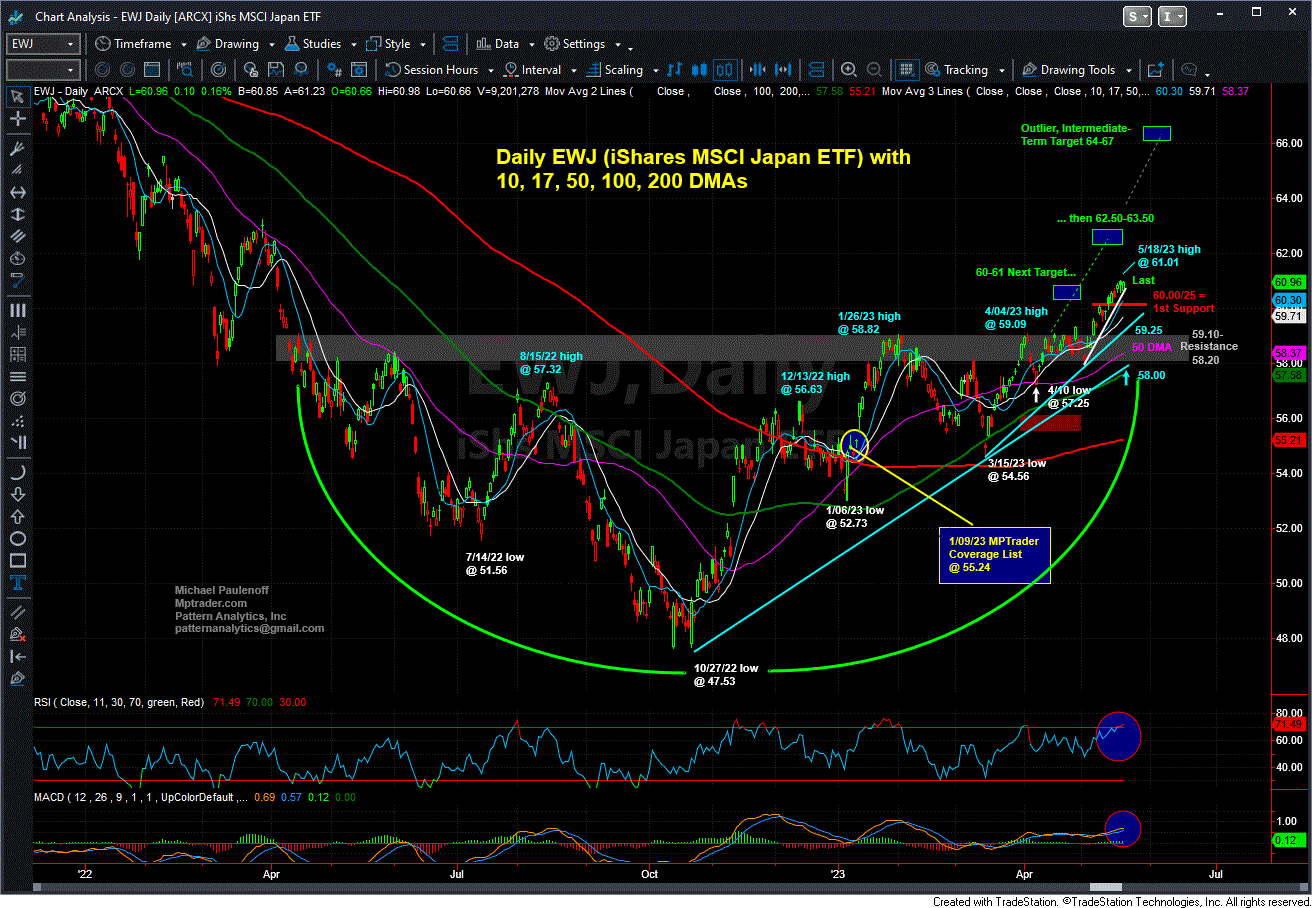
In my reading and research this weekend, my eyebrows did a bit of a backward roll when I saw the budding technical setup in EWJ. While everyone is fixated on China for a host of reasons, the Japan ETF EWJ has quietly carved out a 6-month base formation that is pushing up toward a challenge of multi-month resistance that if hurdled, will trigger a VERY powerful advance that projects to 65-70.
What might this budding technical setup say about an underlying fundamental story or condition? I am thinking a number of things could be influencing a resurgent Japanese equity market such as a weak US Dollar that strengthens the Yen, making equity investments in Yen increasingly attractive going forward. Furthermore, from what I have been reading, Japan will continually have to finance its government deficits through QE which could require the BOJ to sell US paper to acquire the Yen to use to buy JGBs. Without getting too much in the weeds, let's just say that while the Fed is and will remain engaged in QT possibly for all of 2023 to reduce its balance sheet, the BOJ will be doing just the opposite-- employing more good old QE to finance its operations. In a nutshell, the Japanese Government will remain the most manipulative "free" market on the planet, buying up publicly traded Japanese bonds and equities.
Maybe my imagination is way out on a tree limb that will get sawed off. Then again, the base accumulation patterns shown on my attached Daily Chart tell me something is going on, and it is bullish for EWJ. Last is 55.24...
Last Thursday, EWJ hit a 13-month new high of 61.01, a full 10% above Mike's January 9th alert to our members. What's next for EWJ? In that last week's new high was confirmed by Mike's intermediate-term momentum gauges, his work argues strongly that EWJ will climb higher prior to encountering serious headwinds. That said, however, with the price structure only 3.3% above its multi-month upside breakout plateau (59 area), might EWJ pull back in the days ahead to retest its major upside breakout zone? Will the weakness be considered another opportunity to accumulate shares of EWJ, or otherwise, a signal to lock in profits?
Login this week to join Mike and MPTrader members for their actionable technical and fundamental discussions of EWJ as well as many other ETFs, individual equities, major market indices, commodities, precious metals, and Bitcoin.

Mike Paulenoff is the author of MPTrader.com, a real-time diary of his technical analysis & trade alerts on
ETFs for precious metals, energy, currencies, and an array of equity indices and sectors, including international
markets, plus key ETF component stocks in sectors like technology, mining, and banking.
Sign up for a Free 7-day Trial!
More Top Calls From Mike
This past Tuesday, September 26, two days prior to NKE (Nike) earnings, Mike Paulenoff posted one of his pre-earnings "Heads Up" to our members, writing:"Certainly, NKE is oversold enough within a relentless downtrend pattern off of its Feb. 2023 recovery high at 131.31, that a positive reaction to quarterly results reflecting anything other than a disaster coupled with dismal guidance, is likely to trigger an initial positive reaction into the 95 to 100 recovery resistance zone.
On Wednesday, September 7, during one of Mike Paulenoff's frequent intraday updates of the E-Mini SP 500 futures contract (symbol ES) to keep MPTrader members informed about dominant near and intermediate-term trend direction in the index and the SPY ETF, Mike posted an important warning:"ES from a BIG Picture perspective shows the weakness off of last Friday's (9/01) rally high at 4547.75 into this AM's low at 4434.75 (-2.5% of the 4.
Back on June 26th, when nearby WTI Oil futures were circling $67/bbl, Mike Paulenoff issued a heads-up to MPTrader members about a potentially opportunistic technical setup developing in OXY (Occidental Petroleum), writing:"OXY pressed to a low at 55.58 this AM, which marginally violated the 5/11 low at 56.16, BUT held above the more technically significant March 2023 low at 55.51 prior to pivoting to the upside into positive territory, now trading at 57.47.
On Monday August 28, we posted a heads-up about FCX (Freeport-McMoRan) to our MPTrader members, writing: FCX (Copper, Gold, Oil) producer has the right technical look (and a positive momentum divergence at Friday's low) of a completed pullback (44.70 to 37.74) within its larger bullish multi-month Coil formation. Last Friday's (8/25/23) low at 37.74 represented a very healthy 15.6% correction off of the 7/31/23 rally peak at 44.70 and also amounted to an exact Fibonacci 62% retracement of the 5/24/23 to 7/31/23 advance from 33.06 to 44.70.
Top Call: NVDADuring the afternoon trading session of August 23, 2023, prior to the release of NVDA's (Nvidia Corp.) highly anticipated quarterly earnings report, we alerted our MPTrader members to our near-term forecast for NVDA, derived from my technical setup work heading into earnings.