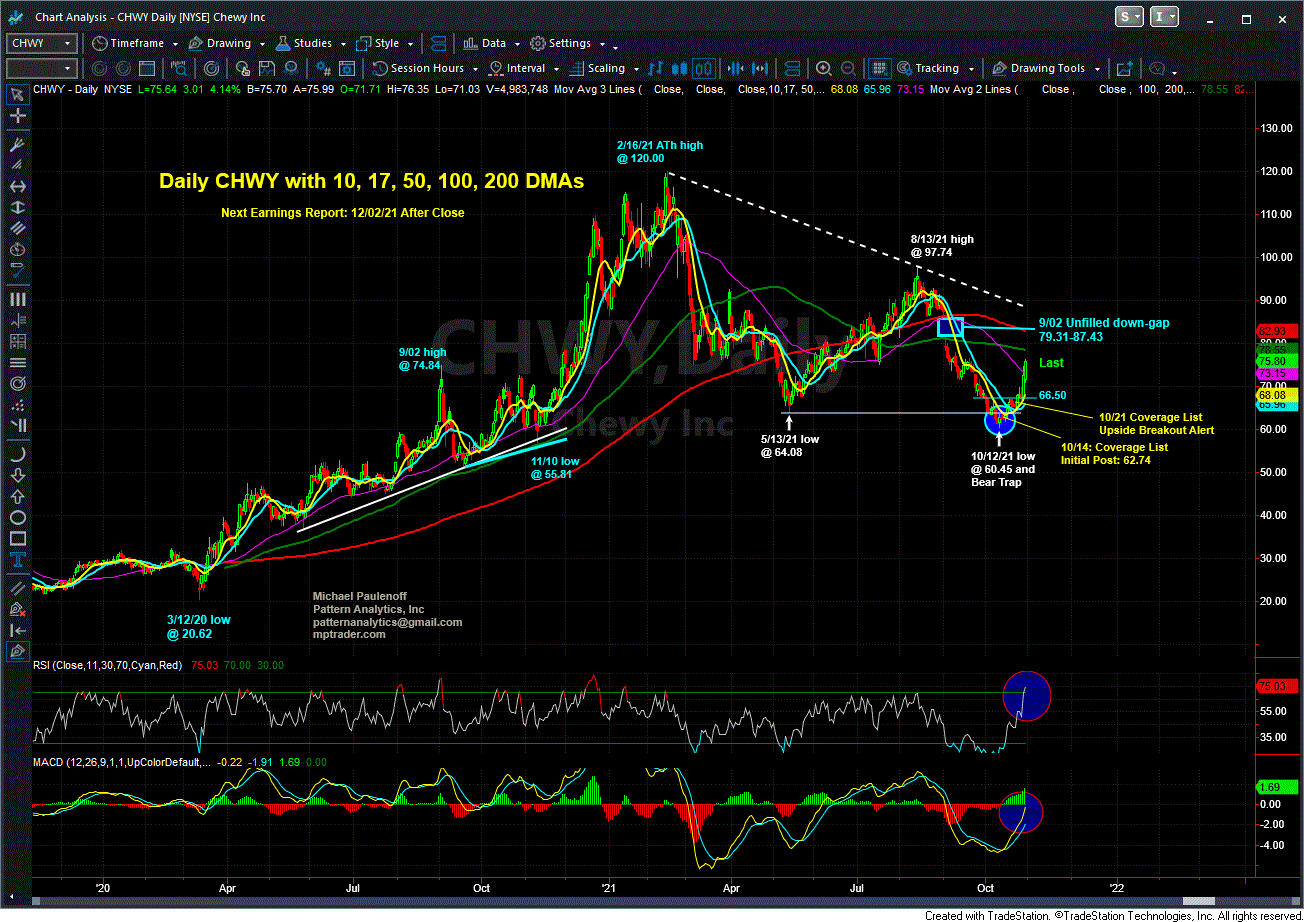
CHWY Follows Our Preferred Technical Price Path

by Mike Paulenoff
October 30, 2021 • 8:40 PM EDT
On the morning of October 14, Mike Paulenoff posted the following time-sensitive comment about CHWY (Chewy Inc) to MPTader members:
"CHWY has the right look of a very mature correction from its ATH at 120 (2/16/21) to Monday's (10/12/21) low at 60.45, which represents a 50% haircut from the ATH. As of this moment, with CHWY trading at 62.72, my work does NOT yet have confirmation that THE LOW has been established. My pattern and momentum work are "warning me" that CHWY's multi-month correction is nearing downside exhaustion. To get confirmation that a significant low has been established, CHWY needs to climb and sustain above 66.50. This name should be on our radar now... Last is 62.74."
Fast-forward exactly one week to October 21, and Mike alerted MPTrader members again:
"CHWY is pushing up against first resistance at 66.50, if taken out and sustained, will point to 72-73 in the aftermath of what increasingly appears to be a Bear Trap multi-month corrective low at 60.45 on Oct. 12th... Last is 66.50."
In the ensuing days, CHWY followed Mike's preferred technical price path, breaking out above 66.50. Then last week it surged to and above 72-73 to Friday's (Oct 29) high at 76.35, a full 22% from his first update and 15% above Mike's technical upside reversal signal.
This prompted Mike to make this late-session chart post on Friday:
"It's a dogs world... Since CHEWY turned up, and triggered an initial buy signal on 10/21 at 66.50, it has climbed 10 points and 15%, and its setup indicates this upmove is not done yet... Last is 75.56."
What's next for CHWY heading towards its early December earnings report? And what's ahead for many other individual equity names that Mike and MPTrader members discuss and analyze throughout each trading day, in addition to in-depth coverage of broadly-held macro indices, ETFs, Cryptocurrencies, and Commodities?
Join Mike and our members for discussion of actionable trading and investment ideas.
On Monday morning, November 13, 2023, a full 5 trading sessions before the approaching November Options Expiration (OPEX) (11/17/23), I posted my chart-based commentary for our members:SPY-- Considering that Friday is November Option Expiration, where are the "magnetized strike prices" as we start OPEX week? Based on my attached Hourly Chart, the magnetized strike price zone spans from 436 to 441. Should SPY take out the upside barrier of 441, then the follow-through outlier magnetized target could be as high as 450 before or on Friday.
On October 23, 2023, ten days before the November 1st FOMC meeting and policy statement, I posted the following commentary about the downward-spiraling TLT (20+ year T-bond ETF):My attached 4-hour Chart of TLT shows that the relentless and near-vertical downtrend that commenced at the beginning of August from around 100 hit a new long-term low at 81.92 this AM, positioning it in my intermediate-term optimal downside target zone from 80 to 82.
On the afternoon of September 25, Mike Paulenoff posted a warning signal to MPTraders members about the developing acute oversold condition in RTX (formerly Raytheon Technologies), writing:"RTX (formerly Raytheon Technologies) hit a new multi-month corrective low of 71.02, down 33% from the 4/10/23 post-pandemic High at 106.02. Although RTX has violated my optimal target window of 73-75, the stair-step corrective pattern off of the 4/19/23 high at 104.
On October 3, Mike Paulenoff posted the following "Heads Up!" about GLD (SPDR Gold Trust, ETF) for MPTrader members: "GLD has pressed to an important technical inflection window from 169.50 down to 166.30, from where I will be expecting corrective downside exhaustion off of the 5/04/23 high at 191.36, and new buying interest. From a nearer-term perspective, given the acute oversold but CONFIRMED Momentum reading of 17.16 an hour ago, my preferred scenario argues for another loop down that marginally violates today's low at 168.
On September 28, 2023, with NVDA trading at 429.31, I told MPTrader members that my work is warning me about a complex technical setup that argues for a prolonged corrective scenario prior to a resumption of dominant uptrend strength. I posted the following:My near-term pattern and momentum work argue that since its 9/21/23 corrective low at 409.