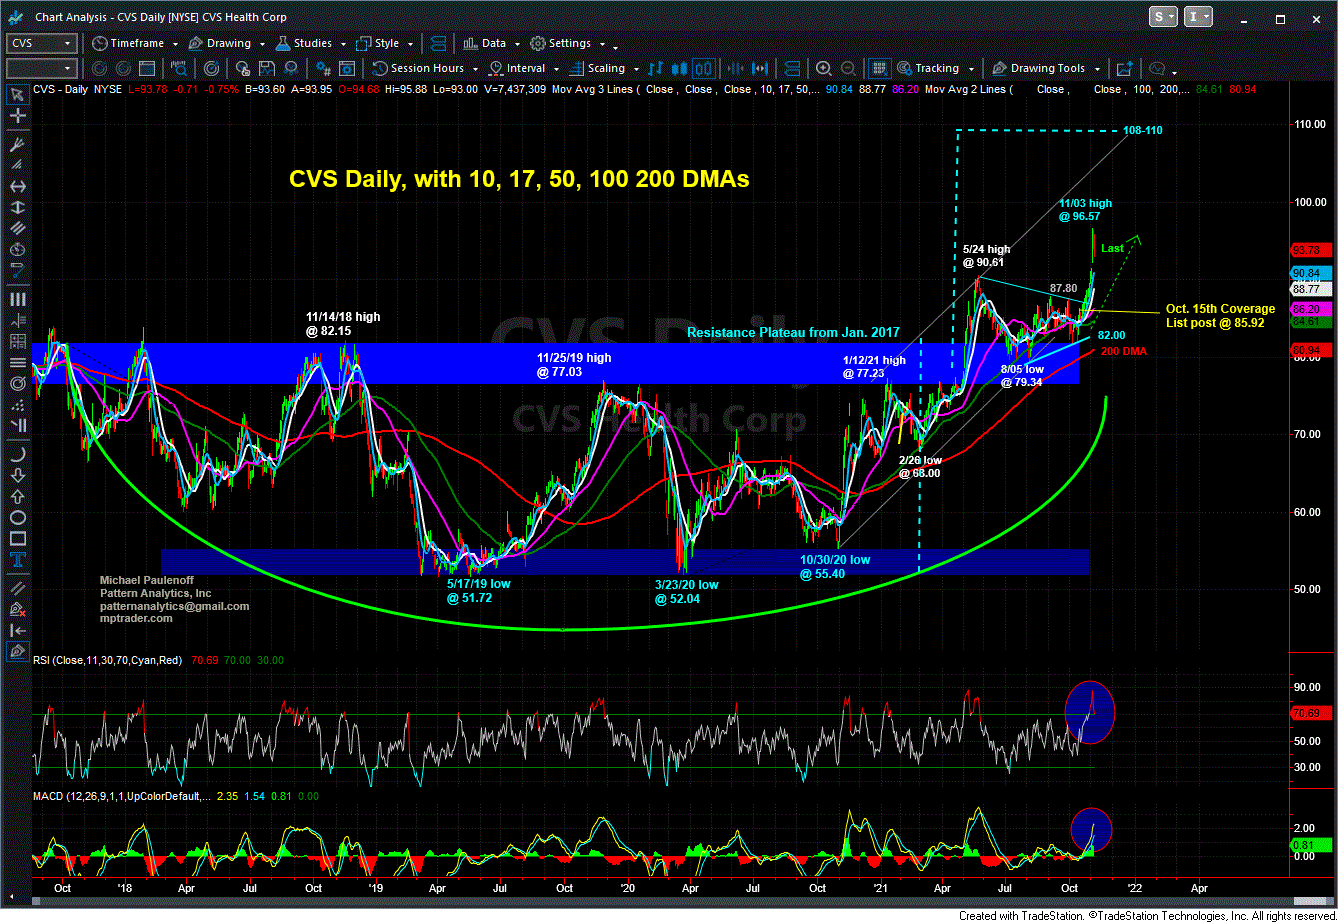
CVS Following Our Technical Prescription

by Mike Paulenoff
November 7, 2021 • 4:55 PM EST
Early on October 15, when CVS Health Corporation (CVS) was trading at 85.92, Mike Paulenoff highlighted upside opportunity for MPTrader members, writing:
"For the past 5 months, CVS has gone pretty much nowhere after hitting a new 6 year high at 90.61 on 5/25/21. It is precisely because CVS has traversed a sideways price path since late May that makes my work interpret the CVS technical setup as extremely promising for a run above 90.61 towards 100, and possibly 108-110 in the upcoming weeks and months."
Mike again wrote positively about the stock on October 20, when it was trading at 86.45, commenting:
"If my intermediate-term technical work is telling us anything about CVS, it is saying, 'watch me rocket above 90 towards a 100+ target!' Only a failure to hurdle 87 followed by a decline beneath 82 will compromise the developing anticipated thrust to the upside."
CVS began climbing on October 26, taking out key resistance at its prior failed rally peak at 87.80, The stock continued to strengthen right into last week's earnings report on November 3, when the company beat the Street's estimates on earnings, revenues, and guidance, propelling the stock to 96.57, its highest price in over five years.
At that high, CVS was 12.4% above its price at Mike's initial alert.
What's next for CVS? The strength of the consumer and another round of Covid-19 (booster) shots tie into the strength of CVS, which according to Mike's technical setup work has unfinished business on the upside as it heads towards 100-102 next. But will there be a period of rest-digestion first?
Join Mike and our MPTrader members for ongoing intraday discussions about CVS, as well as many other stocks, macro indices, ETFs, cryptocurrencies, and commodities.
Thirty minutes after the opening bell on November 24, 2025, I posted the following heads-up to MPTrader members about the technical setup in META:META has the right technical look of a significant U-Turn to the upside after completing a 27% August-November correction from 796.25 (8/15/25) to 580.32 (11/21/25)... To gain more powerful upside traction, META needs to climb and sustain above nearest-term resistance at 614.70 to 616.50, which if (when) taken out, will open a higher price pathway to the 670 area to challenge the down-sloping 200 DMA... Last is 609.27...
Last Friday morning, to calm frazzled nerves amid a 1% pre-market plunge that was threatening to complete a 100% give back of the prior week's 3.
Late on Friday, fellow MPTrader member MarkinQueens exclaimed: Mike's XOM (Exxon Mobil) chart from August is working! Last $117.26!Back on August 25th, this is what we discussed about Crude Oil and XOM:Just in case anyone is wondering what the chart of nearby Crude Oil is looking like as we approach the "official" end of summer.
On August 12, 2025, this was my response to an inquiry from an MPTrader member about intense weakness impacting SMR (NuScale Power Corp):SMR (NuScale Power)-- Fellow member Irv66 asked for an update on this modular nuclear reactor manufacturer that blasted-off from 11.08 in early April to 53.50 at the end of July (+382%), but has since been in the grasp of a major correction from 53.50 to 38.33 (-28.6%). My pattern work argues that SMR is nearing key support from 37.50 down to 33.
ARKK (ARK Innovation Fund, ETF)-- Back on August 20, 2025, this is what we discussed about ARKK:Fellow member Pawel has requested an update on Cathie Wood's fund, which in June thrust up and out of a 3-1/2 year base-accumulation period and pattern above 68.40/50 that subsequently climbed to my initial target in the vicinity of 80 (see my attached Daily Chart). Since the 7/21/25 high at 79.

