Calling AAPL's Upside Continuation ... Ahead Of Upside Exhaustion

by Mike Paulenoff
August 15, 2021 • 12:59 PM EDT
On August 3, Mike Paulenoff alerted MPTrader members to the developing setup in AAPL that also would eventually impact the broader market:
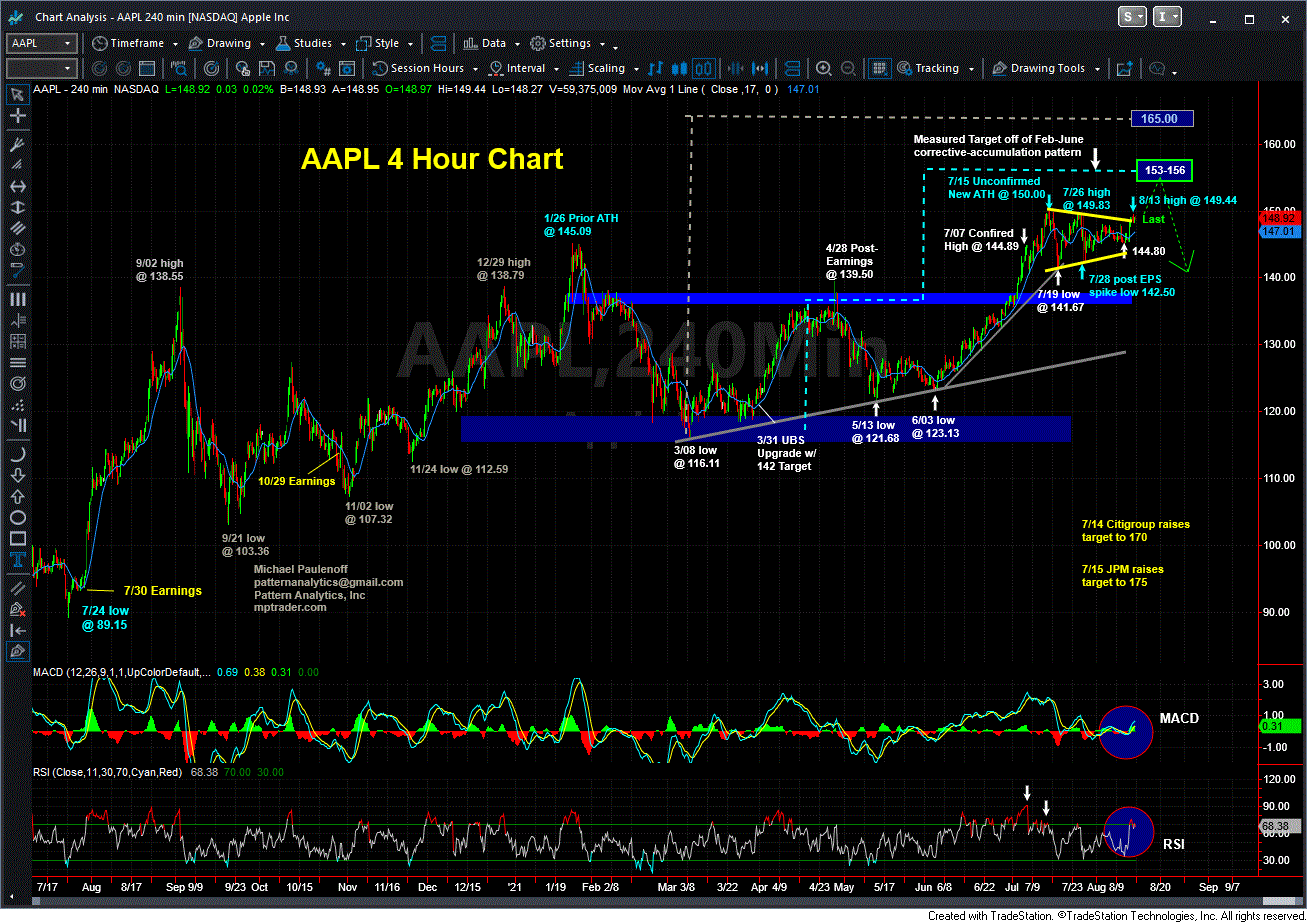
Mike wrote: "AAPL continues to levitate within a high level digestion period and pattern off of its ATH at 150 hit on 7/15. All of the action since mid-July certainly resembles a Triangle pattern atop the May-July upleg from 121.68 to 150.00, which we should treat as a Bull Flag type of potential upside continuation pattern that projects next to 153-156, where I will be watching for signs of upside exhaustion. At the moment, only a decline that breaks support at 144.00 down through 142.50 will inflict damage to AAPL's set up-- and compromise the overall market as well. Last is 147.26."
All through this past week, Mike posted follow-up chart analysis and commentary tracking the price behavior of AAPL within its high-level bullish digestion pattern.
On Friday he wrote:
"Today my eyes will be watching the price behavior of AAPL. My pattern work argues that AAPL is emerging from a one month bullish Coil formation that projects to new ATHs above 150 (7/15), and that could extend into the 153 to 156 target zone. However, should such a scenario unfold, my pattern is also warning me that a climb above 150 at a minimum, and possibly to 153-156 will exhibit the 'right look' of a final thrust within the larger upleg from the 3/08/21 pullback low at 116.11. In other words, if AAPL pops from where it is now at 148.90 to 150.01-- +0.6%, and possibly to 153-156, or 4% to 5% higher, I will be looking for a significant downside reversal signal that also will warn us that the major averages are vulnerable to significant weakness as well."
As it turned out, AAPL climbed from 145.50 to 149.44 on Thursday and Friday, emerging from the four-week triangle formation (see Mike's chart below). On Friday APPL closed just under 149.00, positioning itself for upside continuation to eclipse the prior all-time high at 150.00 from July 15, where Mike's work will begin to watch closely for signs of exhaustion and reversal.
Join Mike and our members for "AAPL Watch" next week, with the stock poised to climb as much as 3%-5% to new all-time highs. But will those new highs be sustainable? If not, will the broad market stumble along with AAPL?
Mike Paulenoff is the author of MPTrader.com, a real-time diary of his technical analysis & trade alerts on
ETFs for precious metals, energy, currencies, and an array of equity indices and sectors, including international
markets, plus key ETF component stocks in sectors like technology, mining, and banking.
Sign up for a Free 7-day Trial!
More Top Calls From Mike
Last Wednesday afternoon (6/11/25), with META circling 700 after establishing a 4-month new post-April 2025 recovery rally high at 708.87, this is what we discussed about the current technical setup: Just a heads up that my pattern work is warning me that the 52% upmove from the 4/07 low at 467.31 to today's (6/11) high at 708.87 has the right look of a completed, overextended, overbought, unconfirmed rally peak that leaves the price structure vulnerable to a correction of some magnitude.
On May 6, 2025, during the final hour of trading, and before AMD was scheduled to report quarterly Earnings that evening, I posted the following analysis to our MPTrader Discussion Room:AMD reports Earnings after the close... The only conviction I can derive from my pattern work is that the 4/08/25 low at 76.48, which represented a 66% correction from the March 2024 high at 227.30, has the right look of a significant low that completed a major bear phase.
On April 22, 2025, I posted the following analysis about my technical setup work in XBI (SPDR SP Biotech ETF):XBI (SPDR SP Biotech ETF)-- Could it be? Could it be that the near-40% correction from the 11/11/24 multi-year high at 105.47 to the 4/09/25 low at 66.66 fully discounted all the bad news in this sector? From a BIG Picture perspective, my attached Daily Chart shows this month's spike low into the vicinity of the previous major corrective low-zone starting in May 2022.
In the early afternoon on April 11, this was my note to our members:"IBIT (iShares Bitcoin Trust ETF)-- From a trading perspective, anyone who is in sync with the Bitcoin setup might consider owning IBIT (iShares Bitcoin ETF) against a stop below its 4/07/25 low at 42.98 (see my attached Daily Chart below)...
Last Thursday (4/17/25) afternoon, ahead of NFLX (Netflix) post-close earnings report and the three-day Good Friday holiday weekend, we discussed the technical setup and whether or not the NFLX pattern was positioned to react positively to the news : The NFLX setup heading into Earnings later today is favorable for upside continuation above the prior two rally highs at 993.45 (4/15) and 998.70 (3/25), but not to a new ATH above 1064.