Calling The Breakdown In IWM ... What's Next?

by Mike Paulenoff
January 23, 2022 • 11:50 AM EST
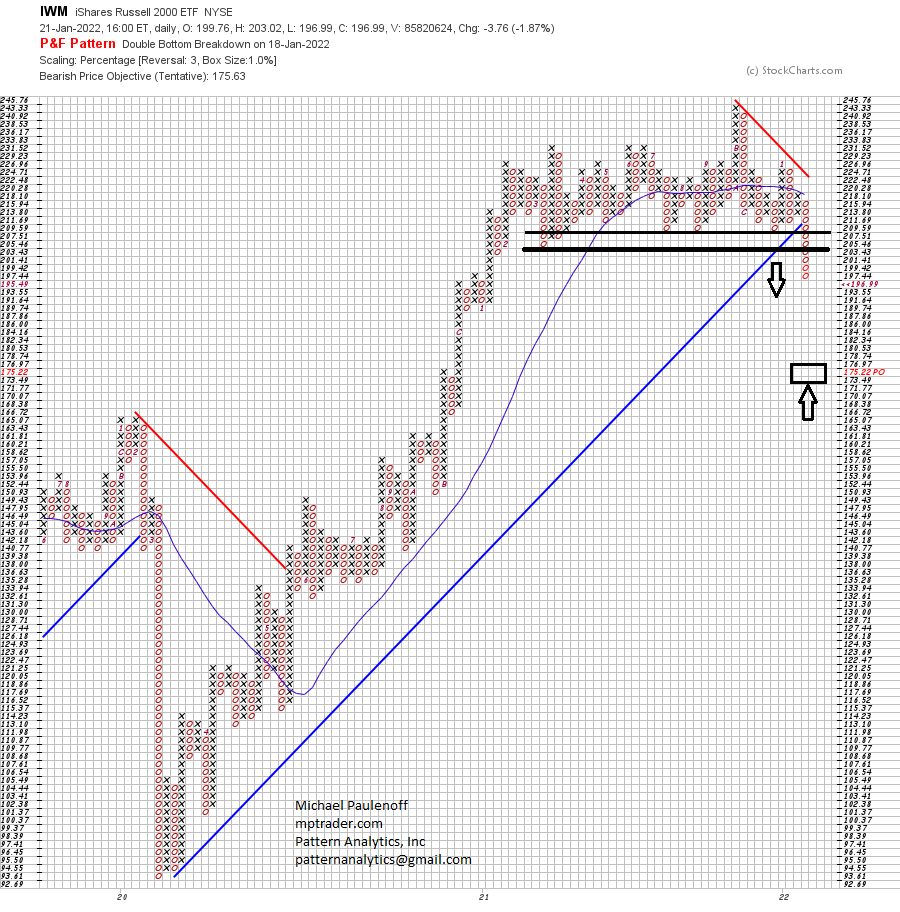
This past Tuesday, January 18, Mike Paulenoff alerted MPTrader subscribers to a developing breakdown in the Russell 2000 Small Cap ETF (IWM).
Mike noted that his Point & Figure chart exhibited an ominous topping formation that threatened to send the IWM nearly 20% lower (downside target near 170) if the Small Cap ETF, which was trading at 209.39 at the time, violated its support plateau and printed 207.50.
IWM pressed beneath that level on Wednesday, prompting a follow-up by Mike in which he noted his next lower target was in the vicinity of 195.50.
That initial target came close to being reached by week's end, with IWM closing at its lows at 196.99.
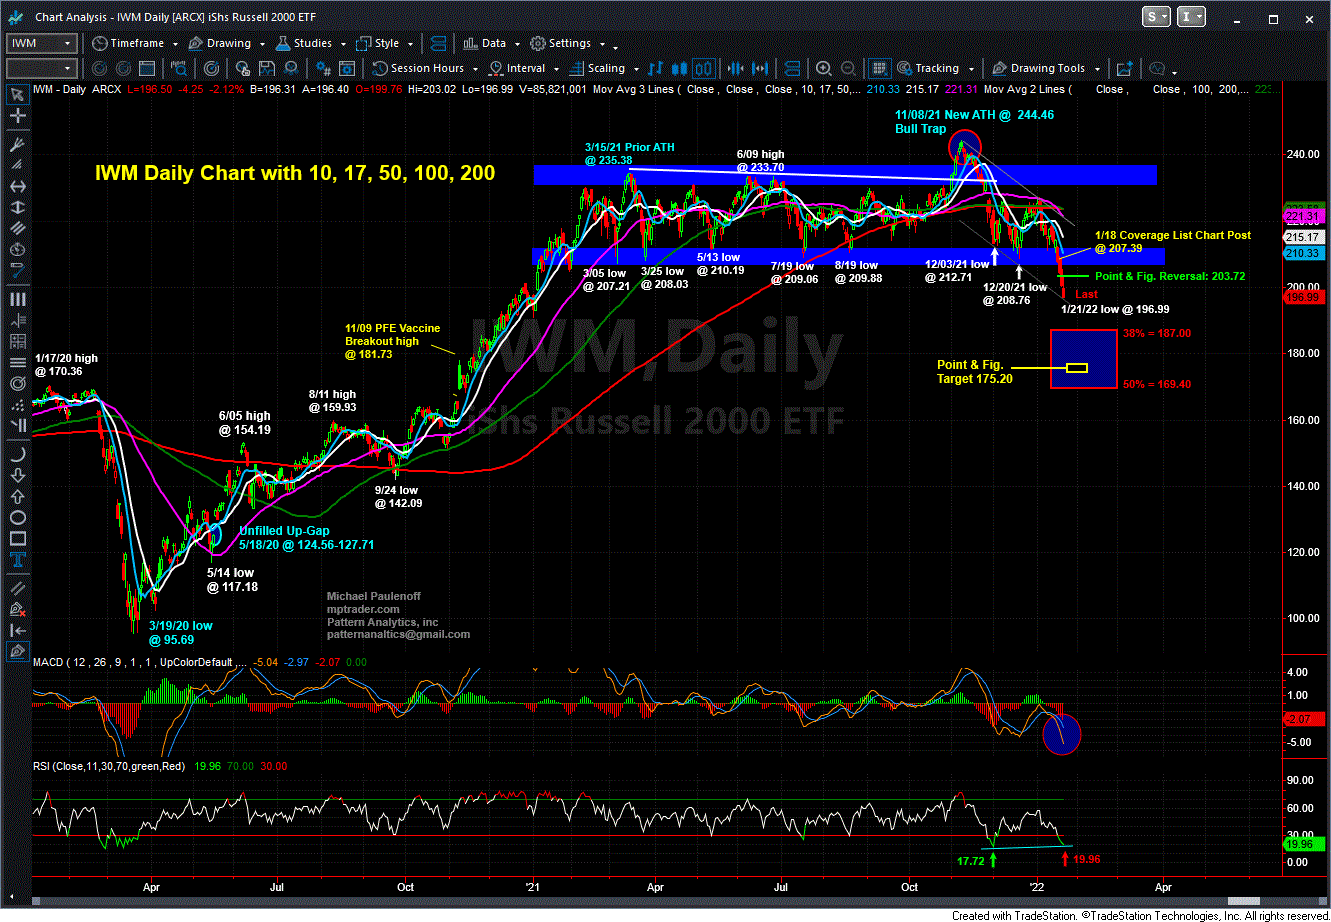
Where is IWM headed next?
Mike's Daily Chart shows the vertically-falling price structure heading for a Fibonacci target zone projected into the 170 to 187 target zone that will amount to a 38% to 50% correction of the post-Pandemic bull phase.
The price action this coming Monday and Tuesday, in particular, will be extremely telling, especially ahead of Wednesday's FOMC Policy Statement and Powell press conference. Will IWM reach its projected downside targets and possibly reverse ahead of or in reaction to the Fed Meeting?
Join Mike and our members for ongoing intraday discussions of indices, ETFs, macro markets, individual stocks, cryptocurrencies, and precious metals as they navigate volatile but opportunistic markets.
Mike Paulenoff is the author of MPTrader.com, a real-time diary of his technical analysis & trade alerts
on
ETFs for precious metals, energy, currencies, and an array of equity indices and sectors, including
international
markets, plus key ETF component stocks in sectors like technology, mining, and banking.
Sign up for a Free 7-day Trial!
On January 2, 2026, this is what I posted about CAVA (Cava Group Casual Mediterranean Cuisine) to MPTrader members:After CAVA's meteoric climb from 29.00 in October 2023 to an ATH at 172.65 in November 2024, the stock rolled over into a relentless decline that hit its low at 43.
On the morning of April 9, 2026, this is what I posted about SMR (NuScale Power Corp) to our Discussion Room for MPTrader members:SMR (Nuscale Power Corp)-- Three views of this beleaguered, former high-flying modular nuclear power producer that has been in the grasp of a relentless six-month, 84% bear phase:-- From the perspective of my 4-hour Chart, SMR has the right look of nearing the completion of the downleg that started at the Jan. 2026 recovery rally high of 22.
On the morning of April 7, 2026, this is what I posted for MPTrader members about my interpretation of the near-term technical setup exhibited by META:My preferred technical scenario for META argues that the stock established a significant near-term low at 520.00 on 3/27/26 that resides within an August 2025 to March 2026, incomplete larger corrective process.
Thirty minutes after the opening bell on November 24, 2025, I posted the following heads-up to MPTrader members about the technical setup in META:META has the right technical look of a significant U-Turn to the upside after completing a 27% August-November correction from 796.25 (8/15/25) to 580.32 (11/21/25)... To gain more powerful upside traction, META needs to climb and sustain above nearest-term resistance at 614.70 to 616.50, which if (when) taken out, will open a higher price pathway to the 670 area to challenge the down-sloping 200 DMA... Last is 609.27...
Last Friday morning, to calm frazzled nerves amid a 1% pre-market plunge that was threatening to complete a 100% give back of the prior week's 3.