Calling The Moves In The US Dollar & Precious Metals

by Mike Paulenoff
November 12, 2022 • 10:55 AM EST
On September 30, 2022, Mike Paulenoff posted the following currency and precious metals commentary to our discussion room at MPTrader:
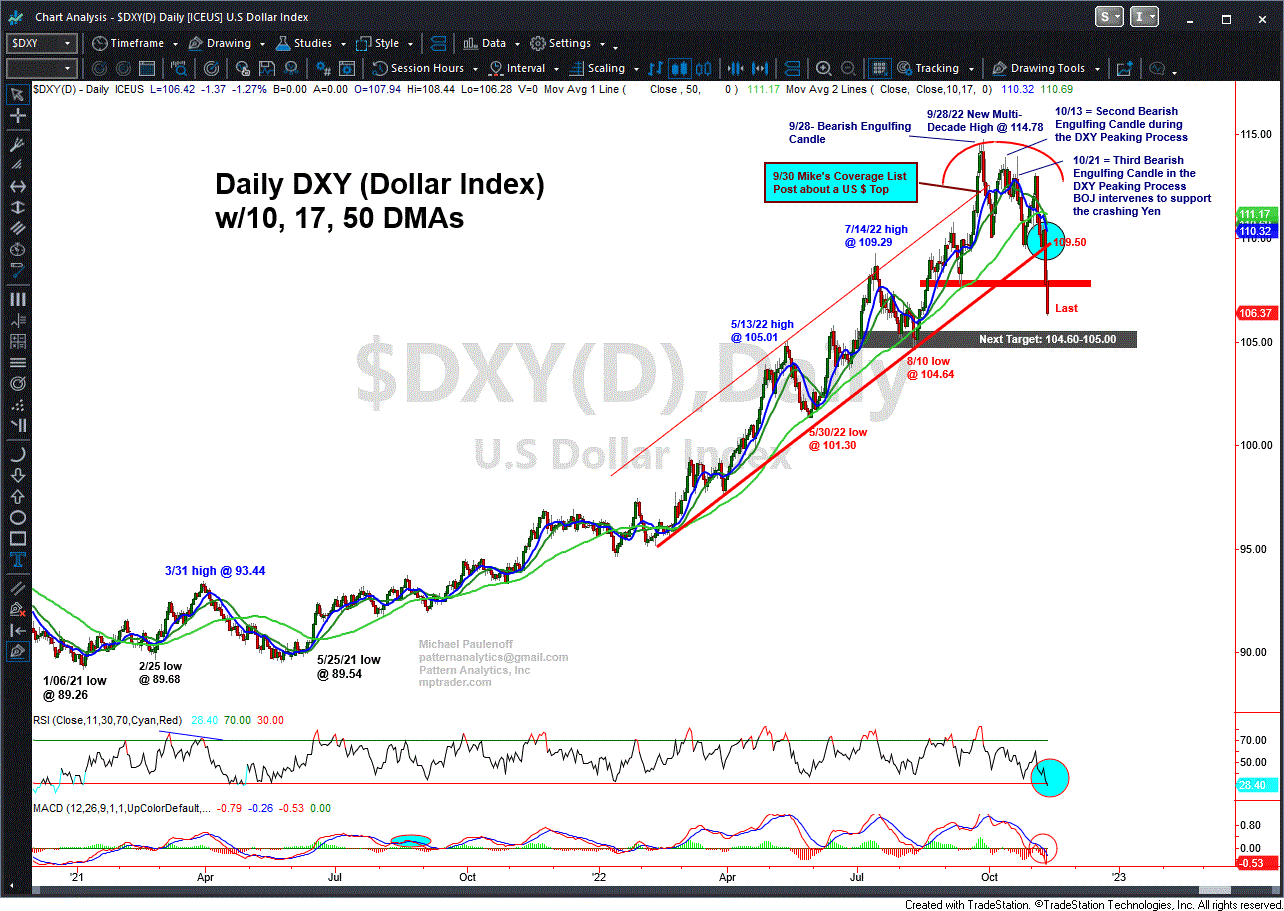
The Dollar and the PM Miners-- I can make a compelling technical argument that this week's major downside reversal in the US Dollar Index (DXY) from a multi-decade high at 114.78 to today's low at 111.58 (see my attached Daily Chart) exhibits bearish form, which informs me that DXY could be in the initial grasp of a significant topping process that will press the Greenback lower for weeks if not months to come.
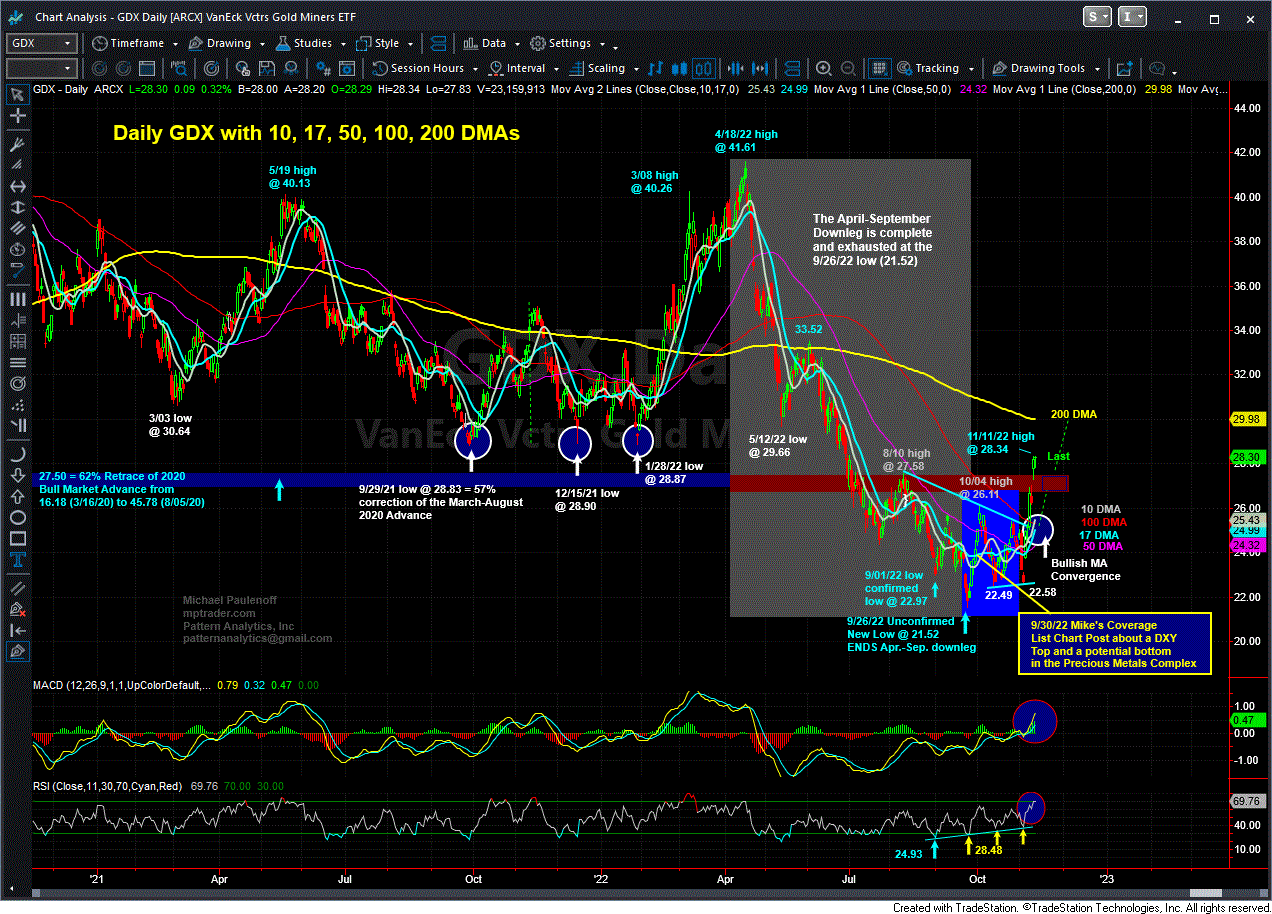
With the foregoing Dollar Index analysis in mind, I can make an even more compelling, more confident argument that GDX (Gold Miners ETF) ENDED the entire April-September downleg from 52.20 to this past Monday's (9/26) low at 28.62. If the Dollar is entering either a period of stagnation or correction, it will cease to exert heretofore intense headwinds on the precious metals complex, and instead-- especially if the Dollar weakens-- could actually provide tailwinds for a period of appreciation for the metals in particular, and the commodity complex in general.
My attached Daily Chart of GDX shows this week's upside reversal action from a 2-1/2 year unconfirmed new low at 21.52 to today's high at 24.55 that is bumping up against its nearest term Aug-Sep resistance line, which if hurdled and sustained, will trigger upside projections to 25.50/70 next. To really gain upside traction, however, GDX needs to take out and hold above 27.60 for a run at its 200 DMA, now at 30.95.
Fast-forward to Friday's (Nov 11) close, we find DXY down a whopping 7.5% from its end-September high and GDX up 17% from Mike's initial chart post to our members -- and up 32% overall. The Dollar has developed a head of steam on the downside, and the Gold Miners ETF (GDX) is in the grasp of the most powerful advance in nearly a year.
How much further does this inverse Dollar-GDX move have left? How long might it last? Join Mike Paulenof and MPTrader members this week for their ongoing technical and fundamental discussions and analysis of GDX, and DXY, as well as many other opportunistic setups in ETFs, individual stocks, macro indices, commodities, and Bitcoin.
Decades of experience matter! Mike Paulenoff started his career in 1980 as a precious and industrial metals commodity analyst for Smith Barney in NYC. He was thrust right into the fire of climbing commodity prices amid runaway inflation until Fed Chairman Paul Volcker suffocated rising price psychology with his draconian interest rate hikes that sent the US economy into the most serious recession since the Great Depression. Some of this sounds VERY familiar, no?
Mike Paulenoff is the author of MPTrader.com, a real-time diary of his technical analysis & trade alerts on
ETFs for precious metals, energy, currencies, and an array of equity indices and sectors, including international
markets, plus key ETF component stocks in sectors like technology, mining, and banking.
Sign up for a Free 7-day Trial!
More Top Calls From Mike
Back on June 26th, when nearby WTI Oil futures were circling $67/bbl, Mike Paulenoff issued a heads-up to MPTrader members about a potentially opportunistic technical setup developing in OXY (Occidental Petroleum), writing:"OXY pressed to a low at 55.58 this AM, which marginally violated the 5/11 low at 56.16, BUT held above the more technically significant March 2023 low at 55.51 prior to pivoting to the upside into positive territory, now trading at 57.47.
On Monday August 28, we posted a heads-up about FCX (Freeport-McMoRan) to our MPTrader members, writing: FCX (Copper, Gold, Oil) producer has the right technical look (and a positive momentum divergence at Friday's low) of a completed pullback (44.70 to 37.74) within its larger bullish multi-month Coil formation. Last Friday's (8/25/23) low at 37.74 represented a very healthy 15.6% correction off of the 7/31/23 rally peak at 44.70 and also amounted to an exact Fibonacci 62% retracement of the 5/24/23 to 7/31/23 advance from 33.06 to 44.70.
Top Call: NVDADuring the afternoon trading session of August 23, 2023, prior to the release of NVDA's (Nvidia Corp.) highly anticipated quarterly earnings report, we alerted our MPTrader members to our near-term forecast for NVDA, derived from my technical setup work heading into earnings.
A week ago Friday, August 10, with SPY (SPDR SP 500 ETF) trading at 446.05, Mike Paulenoff posted a chart commentary to MPTrader members indicating that his technical setup work on SPY was at a critical pattern inflection point.Mike wrote:"Based on today's action, I have come to the conclusion that the "orthodox low" of the decline from the 7/27 high (459.55)... ended at Tuesday's (8/08) low (445.27), and that an intervening counter-trend rally ended at today's (8/10) high (451.
This past Tuesday morning, August 8, Mike Paulenoff responded to a concerned statement from one of our MPTrader members about the TLT (20+ Year T-bond ETF) possibly having turned up in a significant way, especially if weak China data and an "off-sides" crowded hedge fund short position in bonds gets scared (and runs to cover its shorts).