Did You Anticipate Gasoline Futures 2-Week 12% Rise?

by Mike Paulenoff
February 21, 2021 • 11:14 AM EST
Back on February 3, Mike Paulenoff highlighted the potential for a continued rise in gasoline futures.
He told MPTrader members: "Could it be that gasoline is in the eye of a perfect storm? A post-covid, accelerating US economy, a consumer flush with cash ready to jump into the car to spend in restaurants (hopefully) and travel, an Administration looking to reimpose harsh regulations on drilling, fracking, and refining, which reduces supply in an economy that will depend on fossil fuel for years to come. And if this 'Perfect Storm' progresses, won't it be inflationary, or at the least, raise inflationary expectations?"
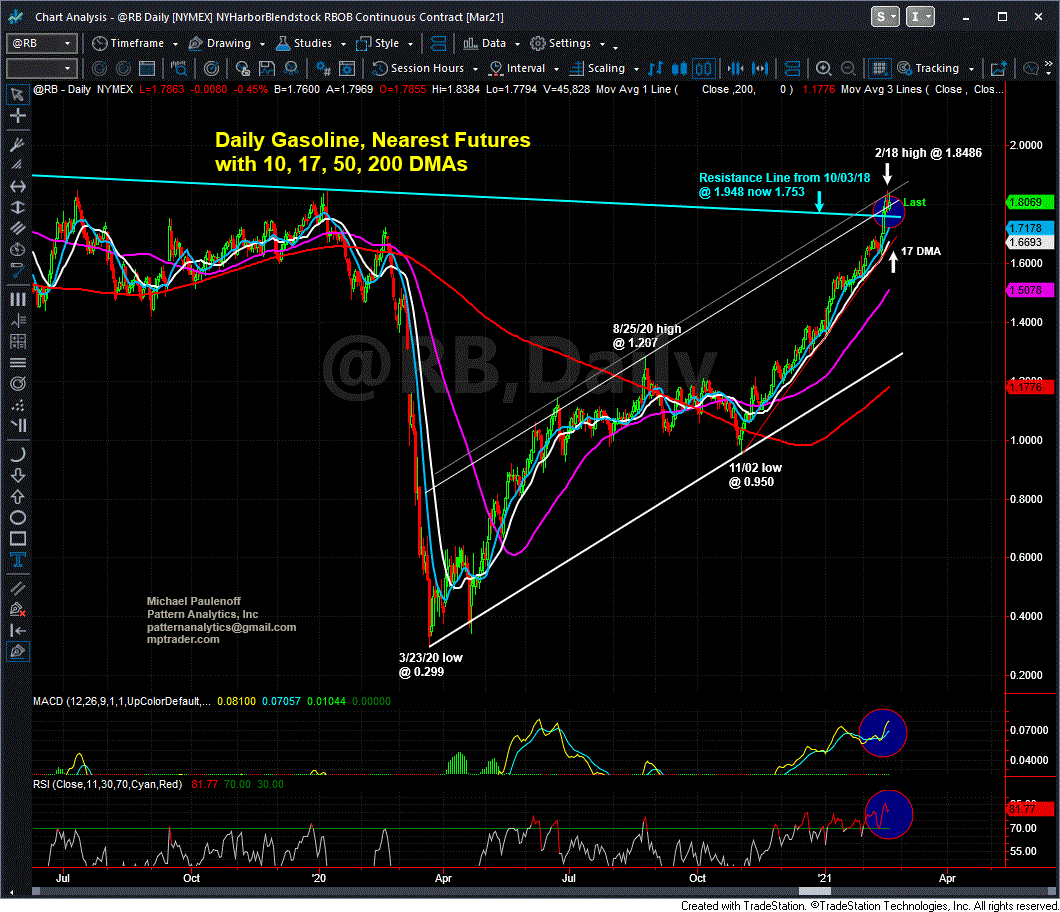
During the subsequent two weeks, RBOB climbed relentlessly to its Feb 18 multi-year high at 1.85 (see our chart), up 12% from Mike's Feb 3 update.
This contributed to propelling the overall energy sector higher, with the XLE (S&P Select Energy SPDR ETF) up 17% and OXY (Occidental Petroleum) up 29%, two components of Energy that Mike monitors and updates frequently for members in his MPTrader Coverage List.
What's next for gasoline now that it has hurdled a resistance line that originated in October 2018 near $2.00/gallon? Will it impact the CPI, consumer behavior, and the underlying energy sector components?
Join us at MPTrader for our analysis, discussions, and the identification of opportunities in stocks, indices, ETFs, commodities, and cryptocurrencies.
Mike Paulenoff is the author of MPTrader.com, a real-time diary of his technical analysis & trade alerts
on
ETFs for precious metals, energy, currencies, and an array of equity indices and sectors, including
international
markets, plus key ETF component stocks in sectors like technology, mining, and banking.
Sign up for a Free 7-day Trial!
XOM (Exxon Mobil)-- Back on May 19, 2026, a fellow MPTrader member requested an update on XOM. This is what we discussed at that time:My attached Daily Chart setup shows my preferred scenario calling for a near-term peak of the current upmove from the 4/17 low at 141.97 to a target zone from 162 to 165, followed by a rollover and press lower that revisits and possibly breaks the 41/7 low, which also will complete the larger corrective process from the 3/30/26 ATH at 176.41.
Pharma Update: MRK and LLYOn Wednesday (6/24/26), this is what we discussed about MRK:MRK as well, which we see on my attached Daily Chart exhbits a VERY BULLISH technical setup-- quite the opposite of beleaguered PFE. My pattern work argues that all of the price action from the 2/25/26 high at 125.14 represents a high-level bullish digestion period and pattern atop the major upleg from the May 2025 low at 73.31.
On January 2, 2026, this is what I posted about CAVA (Cava Group Casual Mediterranean Cuisine) to MPTrader members:After CAVA's meteoric climb from 29.00 in October 2023 to an ATH at 172.65 in November 2024, the stock rolled over into a relentless decline that hit its low at 43.
On the morning of April 9, 2026, this is what I posted about SMR (NuScale Power Corp) to our Discussion Room for MPTrader members:SMR (Nuscale Power Corp)-- Three views of this beleaguered, former high-flying modular nuclear power producer that has been in the grasp of a relentless six-month, 84% bear phase:-- From the perspective of my 4-hour Chart, SMR has the right look of nearing the completion of the downleg that started at the Jan. 2026 recovery rally high of 22.
On the morning of April 7, 2026, this is what I posted for MPTrader members about my interpretation of the near-term technical setup exhibited by META:My preferred technical scenario for META argues that the stock established a significant near-term low at 520.00 on 3/27/26 that resides within an August 2025 to March 2026, incomplete larger corrective process.