Did You Capitalize On This Earnings Call?

by Mike Paulenoff
July 25, 2020 • 12:48 PM EDT
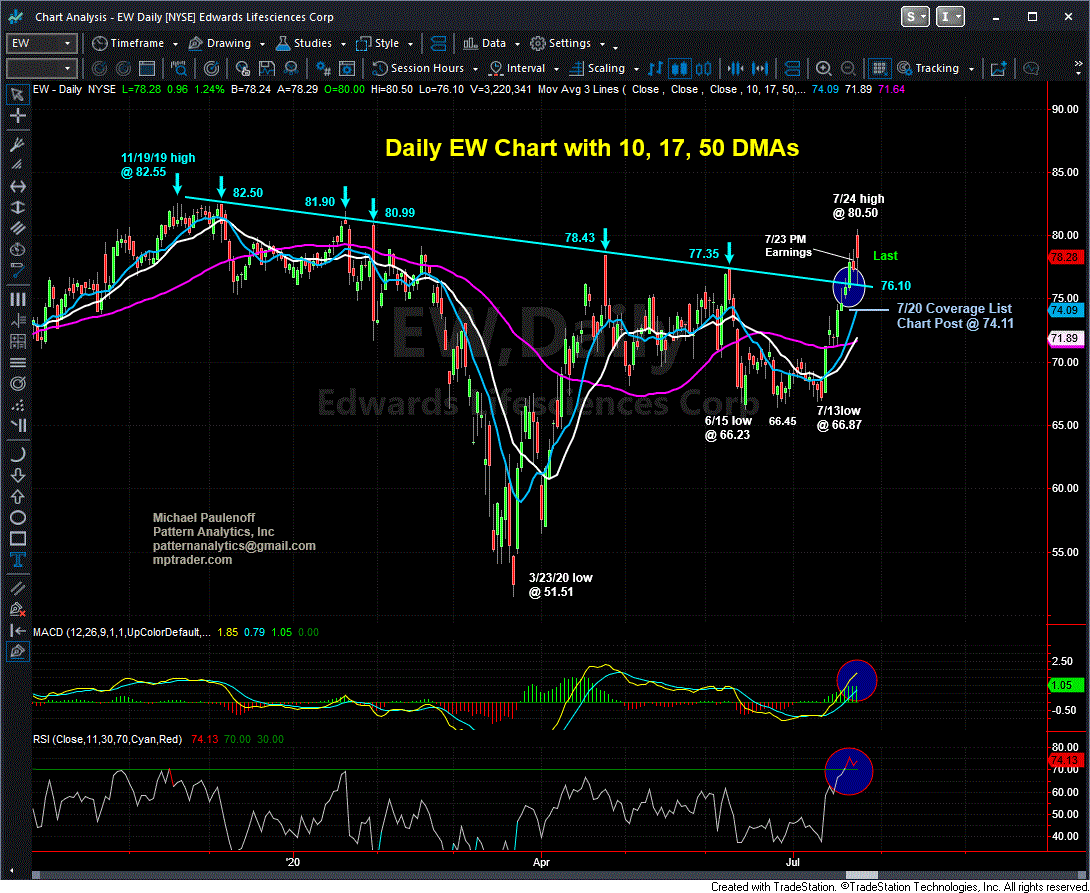
In his Trading Room this week, Mike Paulenoff alerted members to the budding bullish technical potential of Edwards Lifesciences (EW), which was trading at 74.11 at the time of his alert on Monday July 20.
He noted a very positive technical set-up challenging an 8-month resistance line that cut across the price axis at 76.10. He also noted a potential catalyst in the company's upcoming Thursday July 23 earnings release, writing: "If the current chart set up is whispering to us about a directional outcome ahead of or in reaction to earnings, the message is HIGHER."
By Wednesday, EW had thrust above the resistance line to a multi-month high at 78.56, and on Friday it got to as high as 80.50 (+8.6% above its price at Mike's Monday alert) in reaction to an earnings beat on EPS, in-line Revenues, and raised EPS guidance for Fiscal Year 2020.
Where is EW headed next?
Join Our Live Trading Room and find out!
Mike Paulenoff is the author of MPTrader.com, a real-time diary of his technical analysis & trade alerts
on
ETFs for precious metals, energy, currencies, and an array of equity indices and sectors, including
international
markets, plus key ETF component stocks in sectors like technology, mining, and banking.
Sign up for a Free 7-day Trial!
More Top Calls From Mike
Pharma Update: MRK and LLYOn Wednesday (6/24/26), this is what we discussed about MRK:MRK as well, which we see on my attached Daily Chart exhbits a VERY BULLISH technical setup-- quite the opposite of beleaguered PFE. My pattern work argues that all of the price action from the 2/25/26 high at 125.14 represents a high-level bullish digestion period and pattern atop the major upleg from the May 2025 low at 73.31.
On January 2, 2026, this is what I posted about CAVA (Cava Group Casual Mediterranean Cuisine) to MPTrader members:After CAVA's meteoric climb from 29.00 in October 2023 to an ATH at 172.65 in November 2024, the stock rolled over into a relentless decline that hit its low at 43.
On the morning of April 9, 2026, this is what I posted about SMR (NuScale Power Corp) to our Discussion Room for MPTrader members:SMR (Nuscale Power Corp)-- Three views of this beleaguered, former high-flying modular nuclear power producer that has been in the grasp of a relentless six-month, 84% bear phase:-- From the perspective of my 4-hour Chart, SMR has the right look of nearing the completion of the downleg that started at the Jan. 2026 recovery rally high of 22.
On the morning of April 7, 2026, this is what I posted for MPTrader members about my interpretation of the near-term technical setup exhibited by META:My preferred technical scenario for META argues that the stock established a significant near-term low at 520.00 on 3/27/26 that resides within an August 2025 to March 2026, incomplete larger corrective process.
Thirty minutes after the opening bell on November 24, 2025, I posted the following heads-up to MPTrader members about the technical setup in META:META has the right technical look of a significant U-Turn to the upside after completing a 27% August-November correction from 796.25 (8/15/25) to 580.32 (11/21/25)... To gain more powerful upside traction, META needs to climb and sustain above nearest-term resistance at 614.70 to 616.50, which if (when) taken out, will open a higher price pathway to the 670 area to challenge the down-sloping 200 DMA... Last is 609.27...