Forewarning MPT Members Ahead Of Market's Recent Nosedive
On Wednesday, September 7, during one of Mike Paulenoff's frequent intraday updates of the E-Mini S&P 500 futures contract (symbol ES) to keep MPTrader members informed about dominant near and intermediate-term trend direction in the index and the SPY ETF, Mike posted an important warning:
"ES from a BIG Picture perspective shows the weakness off of last Friday's (9/01) rally high at 4547.75 into this AM's low at 4434.75 (-2.5% of the 4.5% gain from 8/18 to 9/01), which we can "imagine" is a potentially meaningful "Right Shoulder" of a June-September developing Top Formation. I am pointing out this potentially damaging setup so we are all forewarned that there IS a very negative scenario developing, provided it satisfies certain criteria, such as continued ES weakness that presses to and beneath very consequential support residing from 4400 (March-September up trendline) down through 4350 (the 8/18/23 pivot low). Right now, my preferred scenario argues for the current pullback to exhibit downside exhaustion in and around 4400-4410 ahead of another upleg that makes a run at 4550-4600. That said, however, let's be mindful that on the Big Picture, the risk that current weakness is putting on our front burner... last is 4442.25..."
With this analysis, MPTrader members were forewarned and also forearmed in case the forthcoming index price action deteriorates during the upcoming sessions, especially considering the likely binary risks implied by the approaching CPI (9/13), PPI and Retail Sales (9/14), and FOMC Policy Decision, Statemen, and Press Conference (9/20).
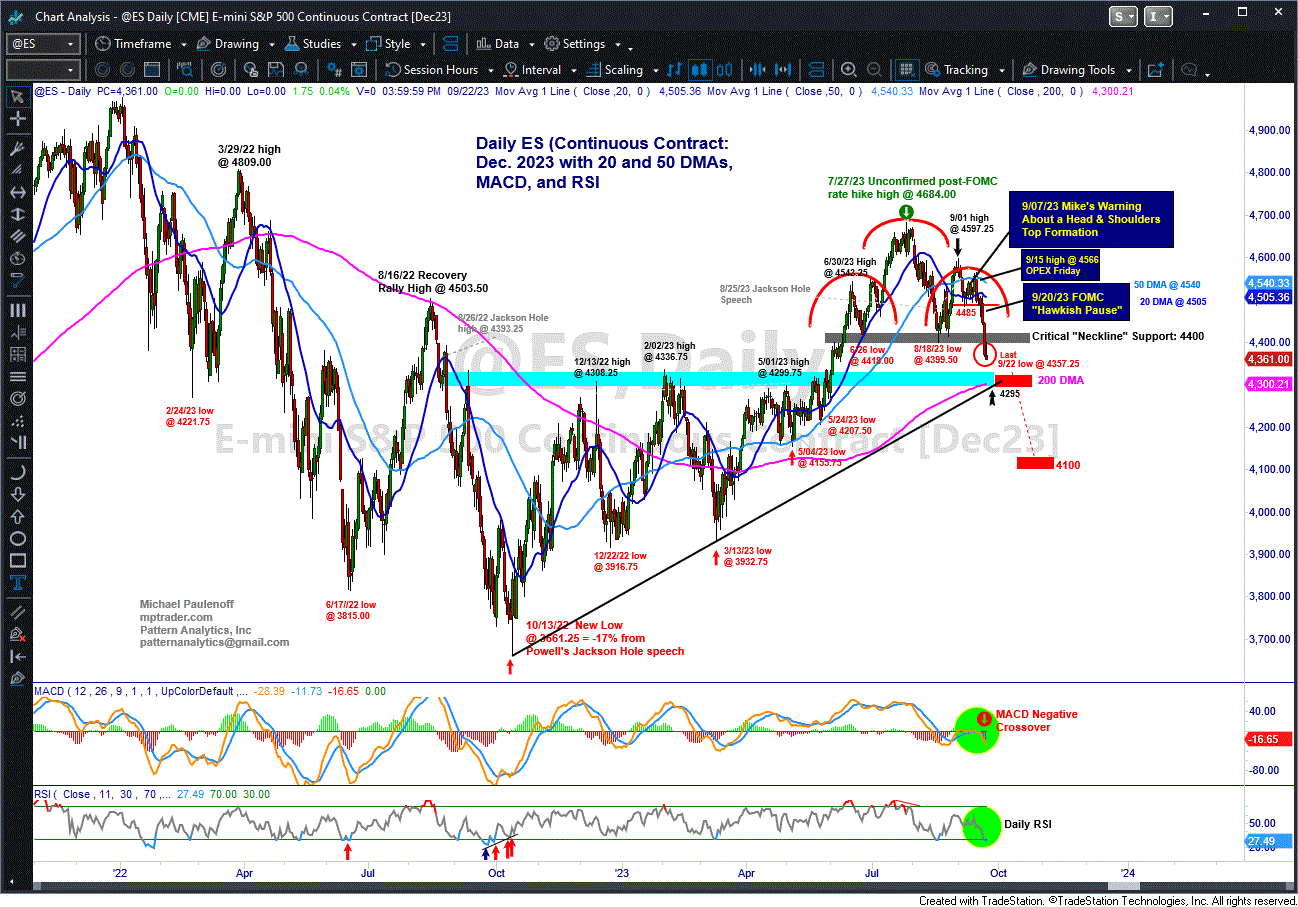
Mike's attached Daily ES Chart shows that starting on Friday, September 15 -- the day of the September Monthly Options Expiration -- ES pivoted to the downside from an intraday high of 4566, and proceeded to nosedive relentlessly for the ensuing week, hitting a low at 4357.25 late last Friday (9/22), a decline of 4.6%.
Most importantly from a pattern perspective is that ES plunged beneath the Neckline of the Head & Shoulders Top formation Mike and our members discussed on September 7th. Last Thursday and Friday, ES pressed beneath the top pattern's critical support plateau at 4400-4410, and closed at 4361.00, well beneath the breakdown level.
Will ES head still lower to test the all-important 200 DMA at 4300, or attempt a short-covering recovery rally to trap the bears?
Login this week to join Mike and our members for their forthcoming analysis and discussions about the price path of ES in the hours directly ahead, as well as Mike's detailed chart work on individual stocks, ETFs, interest rates, oil, and Bitcoin.

