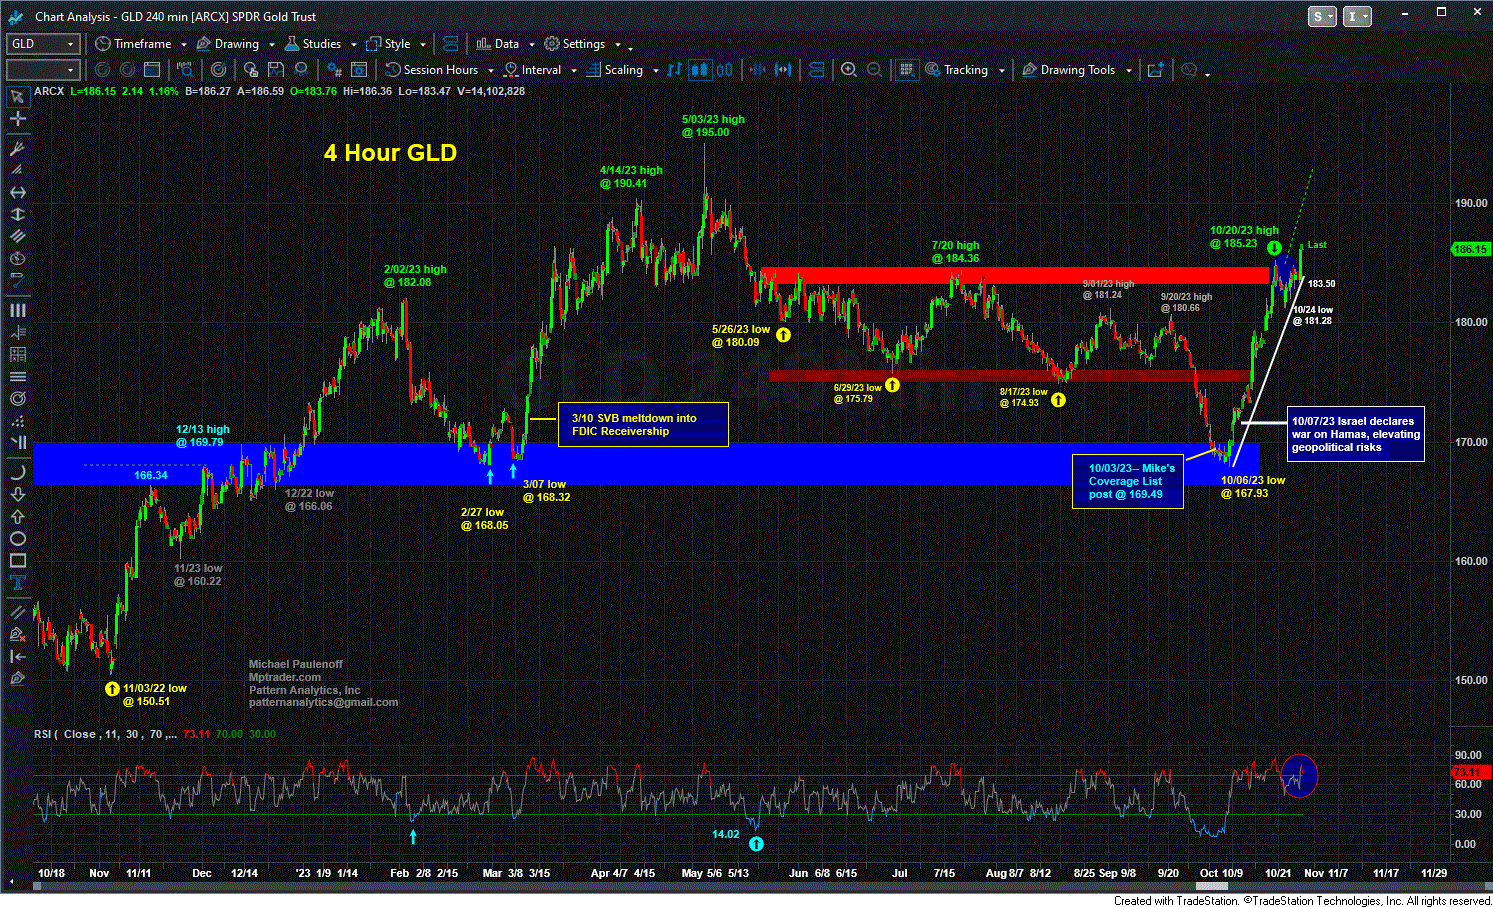
GLD Follows Our Anticipated Upside Reversal Price Path

by Mike Paulenoff
October 29, 2023 • 3:25 PM EDT
On October 3, Mike Paulenoff posted the following "Heads Up!" about GLD (SPDR Gold Trust, ETF) for MPTrader members:
"GLD has pressed to an important technical inflection window from 169.50 down to 166.30, from where I will be expecting corrective downside exhaustion off of the 5/04/23 high at 191.36, and new buying interest. From a nearer-term perspective, given the acute oversold but CONFIRMED Momentum reading of 17.16 an hour ago, my preferred scenario argues for another loop down that marginally violates today's low at 168.74 prior to my expectation of a tradable recovery rally... Last is 169.49..."
Within the subsequent 4 trading sessions, GLD closely followed Mike's anticipated upside reversal price path, initially pressing to a lower corrective low at 167.93 -- still within his optimal downside target window from 169.50 to 166.30 -- prior to pivoting powerfully to the upside, thereafter.
In fact, GLD has never looked back from its 10/06/23 low at 167.93 into this past Friday's high at 186.36. In the 19 trading days since Mike's alert to our MPTrader members, GLD has climbed $16.87, or 10%!
What's next for GLD? Will its strength continue? Is the strength a function of a weaker US Dollar, or alternatively, a result of stubborn inflationary expectations, rapidly rising geopolitical tensions, or debt financing "gone wild?" How about a combination of all of the above?
Join Mike and MPTrader members ASAP for their continuous intraday discussions, chart analysis, and exchange of fundamental ideas on GLD, as well as on many individual stocks, sector ETFs, macro indices, commodities, and Bitcoin.
Mike Paulenoff is the author of MPTrader.com, a real-time diary of his technical analysis & trade alerts on
ETFs for precious metals, energy, currencies, and an array of equity indices and sectors, including international
markets, plus key ETF component stocks in sectors like technology, mining, and banking.
Sign up for a Free 7-day Trial!
Thirty minutes after the opening bell on November 24, 2025, I posted the following heads-up to MPTrader members about the technical setup in META:META has the right technical look of a significant U-Turn to the upside after completing a 27% August-November correction from 796.25 (8/15/25) to 580.32 (11/21/25)... To gain more powerful upside traction, META needs to climb and sustain above nearest-term resistance at 614.70 to 616.50, which if (when) taken out, will open a higher price pathway to the 670 area to challenge the down-sloping 200 DMA... Last is 609.27...
Last Friday morning, to calm frazzled nerves amid a 1% pre-market plunge that was threatening to complete a 100% give back of the prior week's 3.
Late on Friday, fellow MPTrader member MarkinQueens exclaimed: Mike's XOM (Exxon Mobil) chart from August is working! Last $117.26!Back on August 25th, this is what we discussed about Crude Oil and XOM:Just in case anyone is wondering what the chart of nearby Crude Oil is looking like as we approach the "official" end of summer.
On August 12, 2025, this was my response to an inquiry from an MPTrader member about intense weakness impacting SMR (NuScale Power Corp):SMR (NuScale Power)-- Fellow member Irv66 asked for an update on this modular nuclear reactor manufacturer that blasted-off from 11.08 in early April to 53.50 at the end of July (+382%), but has since been in the grasp of a major correction from 53.50 to 38.33 (-28.6%). My pattern work argues that SMR is nearing key support from 37.50 down to 33.
ARKK (ARK Innovation Fund, ETF)-- Back on August 20, 2025, this is what we discussed about ARKK:Fellow member Pawel has requested an update on Cathie Wood's fund, which in June thrust up and out of a 3-1/2 year base-accumulation period and pattern above 68.40/50 that subsequently climbed to my initial target in the vicinity of 80 (see my attached Daily Chart). Since the 7/21/25 high at 79.

