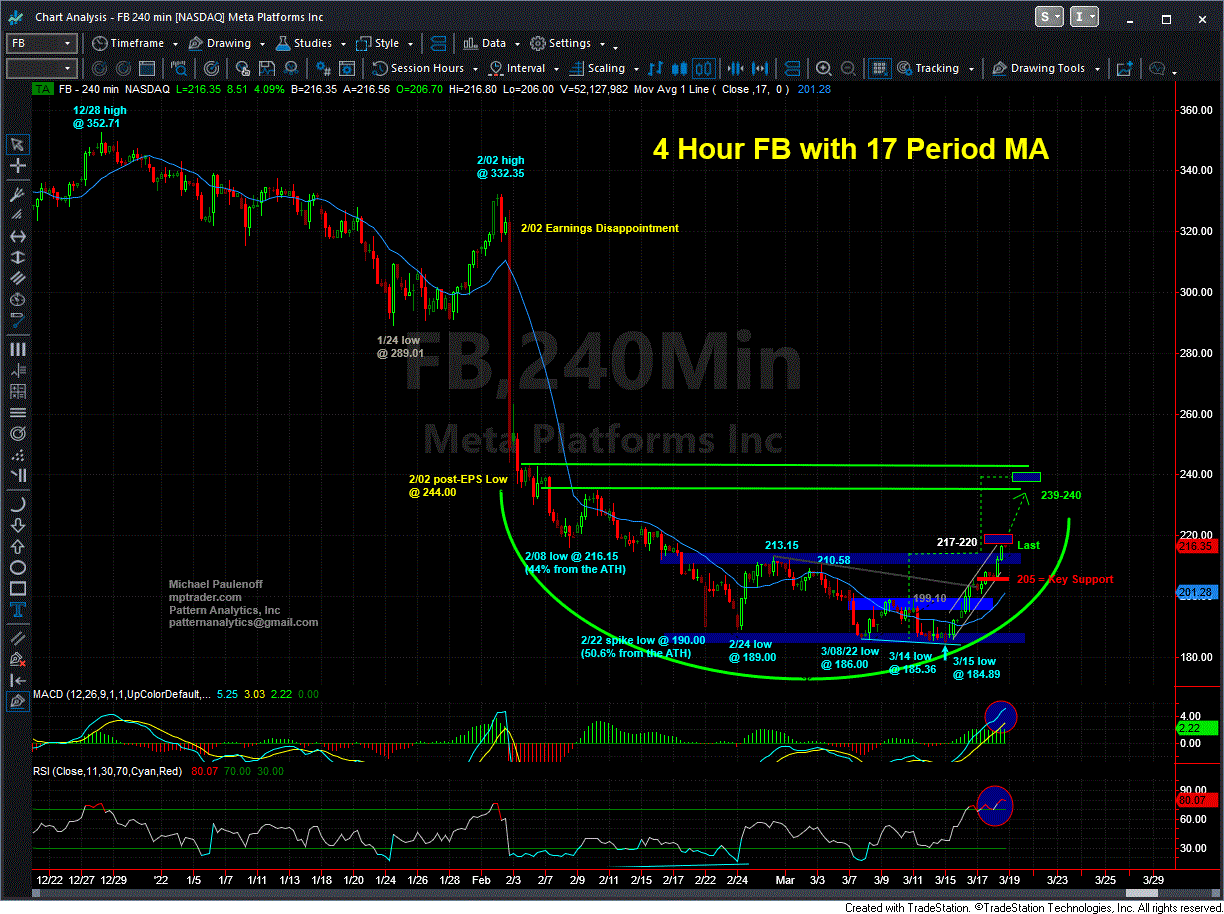
Getting The Jump On FB's 13% Climb
During the past 4 weeks, Mike Paulenoff has frequently updated and posted his chart analytics of Facebook (FB) ahead of a potentially rewarding near-term buy signal as the stock searched for a significant low in the aftermath of its disappointing February 2, 2022 earnings report.
FB initially plunged from a 332 high just prior to the report to the 215 area days later, but then proceeded to stair-step still lower to 184.89 on March 15 during the relentless selling pressure in the technology sector from mid-February to mid-March. At its March15 low, FB had lost 45% of its value from the close on February 2, and 52% of its value from its all-time high of 384.33 (from September 1, 2021)!
Last Monday (March 14), with the stock at 186.10, Mike posted his chart analysis along with this heads up to MPTrader members:
"Bottom Line Technically: unless and until FB can climb above 197.00-200.00, it will remain vulnerable to another bout of 'capitulation' weakness into the 180 target zone. From an intraday perspective, a sustained climb above 191.60 today will be a very promising sign that FB is poised to challenge 197-200."
Mike followed up with another timely update on Wednesday afternoon, with FB trading at 198.18:
"My nearest term pattern work argues that FB exhibits bullish form off of yest's low at 184.89 into today's high at 201.99, which tells us that there is more upside ahead, even if FB needs to pull back from 201.99. The two key support levels are 196.50 and if violated, then at 191.00 to 192.40 [the zone] from where I will be expecting another upleg that propels FB above 202 and above 204.50 to challenge much more consequential resistance from 210.50 to 213.15."
Then on Friday morning, with FB at 211.89, Mike again provided MPTrader members additional guidance about FB:
"Bottom Line: As long as any forthcoming weakness holds above 205.00... AND provided FB closes above 213.15, my pattern work will trigger upside projections initially to 217-220, and then to 236-240... All of the action in FB since mid-February is morphing into a Rounded Corrective Bottom that supports a swing target into the vicinity of 240."
As it turned out, FB closed at 216.35 on Friday. From the 191.60 breakout level that Mike highlighted on Monday, FB climbed 13%.
And according to Mike's work, FB still has considerable room to continue to climb in the days and weeks ahead.
How will traders navigate the twists and turns in FB this coming week? Join Mike and MPTrader members for their constant intraday discussions and chart analyses about individual stocks like FB as well as ETFs, Macro Indices, Commodities, and Bitcoin.

