Getting a Jump On the SONO Rally

by Mike Paulenoff
October 3, 2020 • 12:00 AM EDT
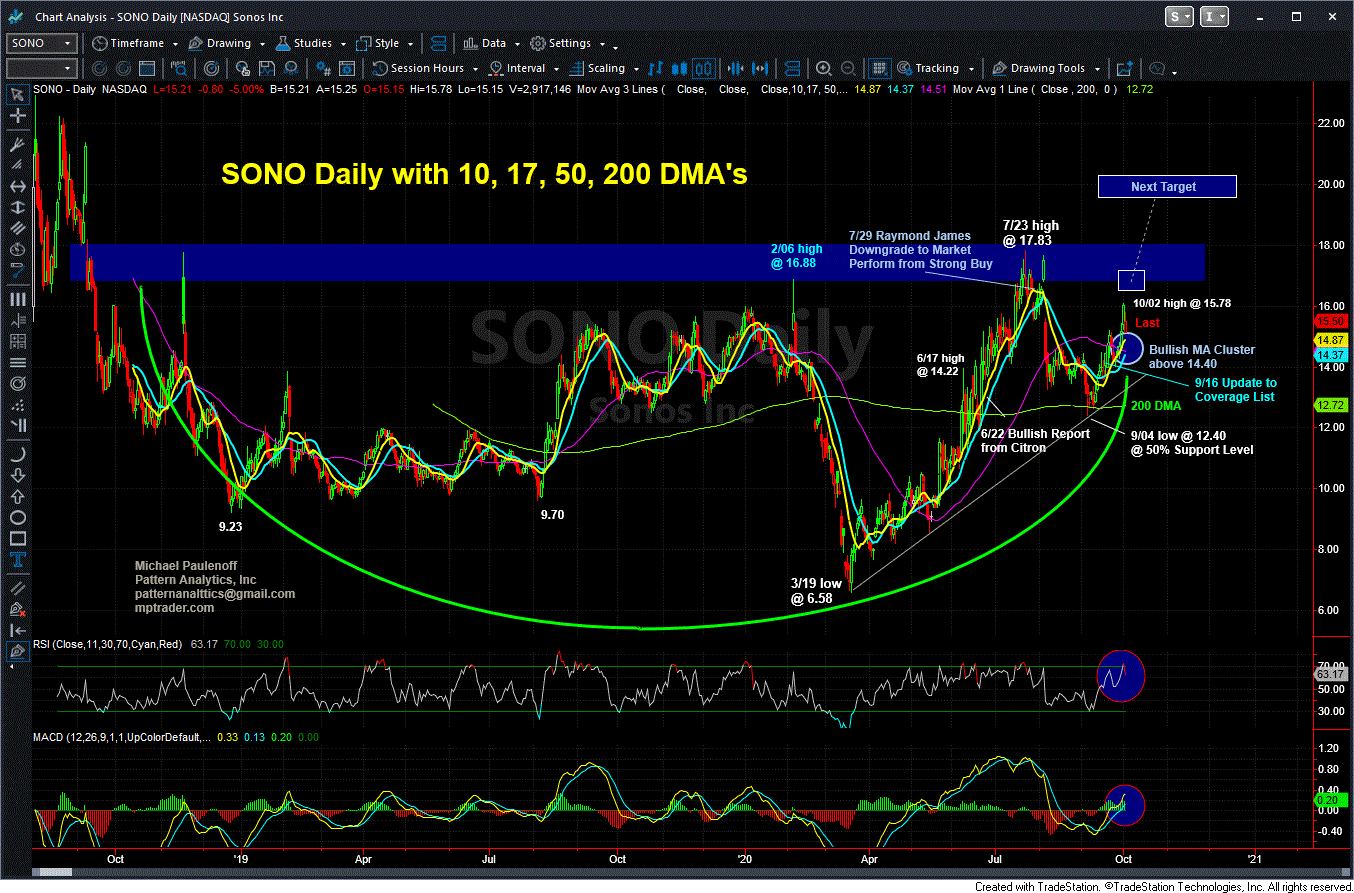
Back on Sep 16, Mike Paulenoff told MPTrader members that Sonos (SONO), the under-the-radar, work-at-home speaker company, had triggered initial buy signals.
Mike explained that the stock, which was trading at 14.35/36 at the time, had climbed above its up-turning 10 and 17 DMAs, in route to a challenge of the "flattish" 50 DMA, now at 14.75.
He wrote: "The recent low at 12.40 on 9/04 represents an exact 50% retracement of the major upleg from the March low at 6.58 to the July high at 17.83, and as such, the sharp upturn from 12.40 to 14.36 during the past week or so, is a technical signal that a correction within an otherwise bull phase is complete."
SONO went on to reach a high of 16.10 this past week, up 12% from Mike's Sep 16 alert, and on Wednesday Sep 30, Mike wrote:
"SONO has popped above its flattening 50 DMA (14.56) today, extending the rally off of the 9/04 corrective low at 12.40. The longer SONO remains above 14.56, the more likely it accelerates towards 17.00 next, in route to a full-fledged test of the 7/23 high at 17.83."
See the SONO chart below.
From a macro perspective, with Covid again rearing its ugly head in a very public way, directly impacting the Trump Administration, SONO could also benefit from another round of stay-at-home spending and "Covid stocks" generally attract another wave of investor interest.
Join Mike and his MPTrader community as they monitor SONO in the days and weeks ahead.
Mike Paulenoff is the author of MPTrader.com, a real-time diary of his technical analysis & trade alerts
on
ETFs for precious metals, energy, currencies, and an array of equity indices and sectors, including
international
markets, plus key ETF component stocks in sectors like technology, mining, and banking.
Sign up for a Free 7-day Trial!
Thirty minutes after the opening bell on November 24, 2025, I posted the following heads-up to MPTrader members about the technical setup in META:META has the right technical look of a significant U-Turn to the upside after completing a 27% August-November correction from 796.25 (8/15/25) to 580.32 (11/21/25)... To gain more powerful upside traction, META needs to climb and sustain above nearest-term resistance at 614.70 to 616.50, which if (when) taken out, will open a higher price pathway to the 670 area to challenge the down-sloping 200 DMA... Last is 609.27...
Last Friday morning, to calm frazzled nerves amid a 1% pre-market plunge that was threatening to complete a 100% give back of the prior week's 3.
Late on Friday, fellow MPTrader member MarkinQueens exclaimed: Mike's XOM (Exxon Mobil) chart from August is working! Last $117.26!Back on August 25th, this is what we discussed about Crude Oil and XOM:Just in case anyone is wondering what the chart of nearby Crude Oil is looking like as we approach the "official" end of summer.
On August 12, 2025, this was my response to an inquiry from an MPTrader member about intense weakness impacting SMR (NuScale Power Corp):SMR (NuScale Power)-- Fellow member Irv66 asked for an update on this modular nuclear reactor manufacturer that blasted-off from 11.08 in early April to 53.50 at the end of July (+382%), but has since been in the grasp of a major correction from 53.50 to 38.33 (-28.6%). My pattern work argues that SMR is nearing key support from 37.50 down to 33.
ARKK (ARK Innovation Fund, ETF)-- Back on August 20, 2025, this is what we discussed about ARKK:Fellow member Pawel has requested an update on Cathie Wood's fund, which in June thrust up and out of a 3-1/2 year base-accumulation period and pattern above 68.40/50 that subsequently climbed to my initial target in the vicinity of 80 (see my attached Daily Chart). Since the 7/21/25 high at 79.