Has the AI Movement Shifted into High Gear? (And What That Means for MSFT vs GOOG)
by Mike Paulenoff
February 11, 2023 • 2:53 PM EST
Has the AI (Artificial Intelligence) movement shifted into high gear, and what to do about it?
Believe it or not, it has been 24 years since Michael Lewis penned his influential Silicon Valley missive, The New New Thing, which described the budding internet revolution.
Maybe last week we were introduced to the next New New Thing?
After last week's unveiling of MSFT's $10 billion investment in OpenAI (Chatbot) to enhance its Advanced Search Engine Bing, suddenly GOOG's dominance of the Search market could be (is?) under threat. After all, GOOG purportedly controls 93% of the search market compared with 3% for MSFT (according to Statcounter), so ANY measurable uptick in market share for Bing could translate into billions of dollars of additional revenue for MSFT.
If MSFT's threat weren't enough to pique the interest of investors, the fact that GOOG had a flawed rollout of its new AI Chatbot, Bard, last week certainly was a bad look that added fuel to the search engine fire.
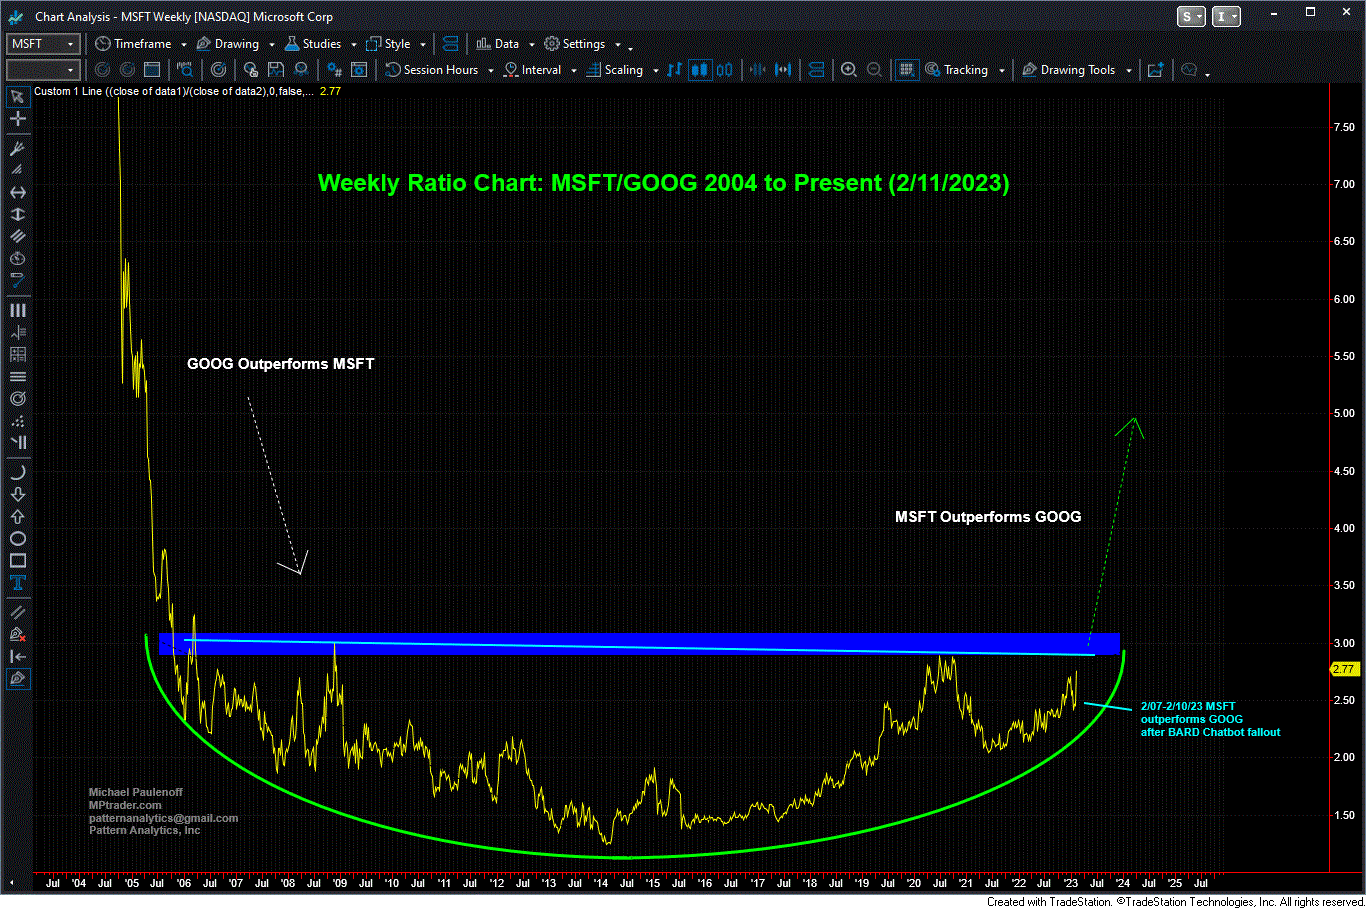
This morning I got to thinking about the relationship between these two mega-caps which led me to create a longer-term Ratio Chart (the price of MSFT divided by the price of GOOG) to see the relative performance of the two names. To my surprise, the emergent picture is shocking and exciting (see below) because, in no uncertain terms, the vast multi-year base formation in the Ratio is looking like a powerful Rounded Bottom Formation that argues strongly for years of future outperformance of MSFT relative to GOOG.
This new Chatbot AI Search "arms race" between MSFT and GOOG looks to me to favor a period of significant outperformance from MSFT while GOOG finds itself on the defensive.
If you run a multi-billion dollar hedge fund, the implication from the attached chart is to establish a spread trade, long MSFT, short GOOG.
If you are mere mortals like us, then the implication is that you own MSFT and ALSO own GOOG, but less of it, such as a 2 to 1 ratio of MSFT shares to GOOG shares.
Why not join us at MPTrader for more discussions and studies like this? All through every trading day, we discuss the technical and fundamental outlooks and strategies for individual stocks, ETFs, macro indices, commodities, and Bitcoin.
On August 27, 2024, I reviewed my near and intermediate-term technical setup on copper (gold, silver, oil) producer FCX (Freeport-McMoRan) for MPTrader members, writing:My attached Daily Chart shows the 30% correction from the May 2024 high to the August 2024 low, which my pattern work argues ended the retracement of the first upleg of a new bull phase in FCX that began at the 10/23/23 low of 33.08 and ended at the 5/20/24 high of 55.24. The August 2024 upmove from 39.08 (8/05/24) to 46.
On August 5, hours before its after-market earnings report, Mike Paulenoff posted a bullish alert on AI-juggernaut PLTR, writing:"Bottom Line Technically: As long as any forthcoming weakness on a closing basis remains above key support lodged between 19.60 and 21.50, PLTR has the right look of nearing the completion of the correction from its 7/08/24 high at 29.83, and the initiation of another advance that will extend the upside potential off of a two-year base-accumulation setup."The stock, trading at 23.
Three hours before the July Fed 31, 2024 (FOMC) meeting, I posted the following chart commentary about my technical setup work on 10-year Treasury YIELD and its actionable longer-term Treasury bond ETF, the TLT (20+ Year T-bond, ETF):Heading toward Fed Time, 10-year YIELD and TLT (20+ Year T-bond ETF) certainly appear to be anticipating lower interest rate news or innuendos from the FOMC statement (guidance) and Jay Powell in his post-meeting press conference.
On August 15, with XLV (Healthcare SPDR, ETF) approaching Mike Paulenoff's target zone (noted in an April 18th post), Mike responded to an MPTrader member's question about whether it was "time to sell and find something with more potential?" Mike wrote: "My short answer: no, it is not yet time to sell (although I will never dissuade anyone from taking profits and from ringing the cash register). My pattern and momentum work argue that upside potential extends from 156 to 161.
On August 6th, when UBER was trading 62, this is what Mike Paulenoff discussed with MPTrader members about the stock's technical setup in the immediate aftermath of the company's quarterly earnings report:"UBER... produced stellar earnings, albeit a bit light on next quarter's bookings. The stock is up 5.9% in pre-market trading within a near-term setup that argues yesterday's spike low at 53.25 ended a 35% correction off of the March high at 82.14.