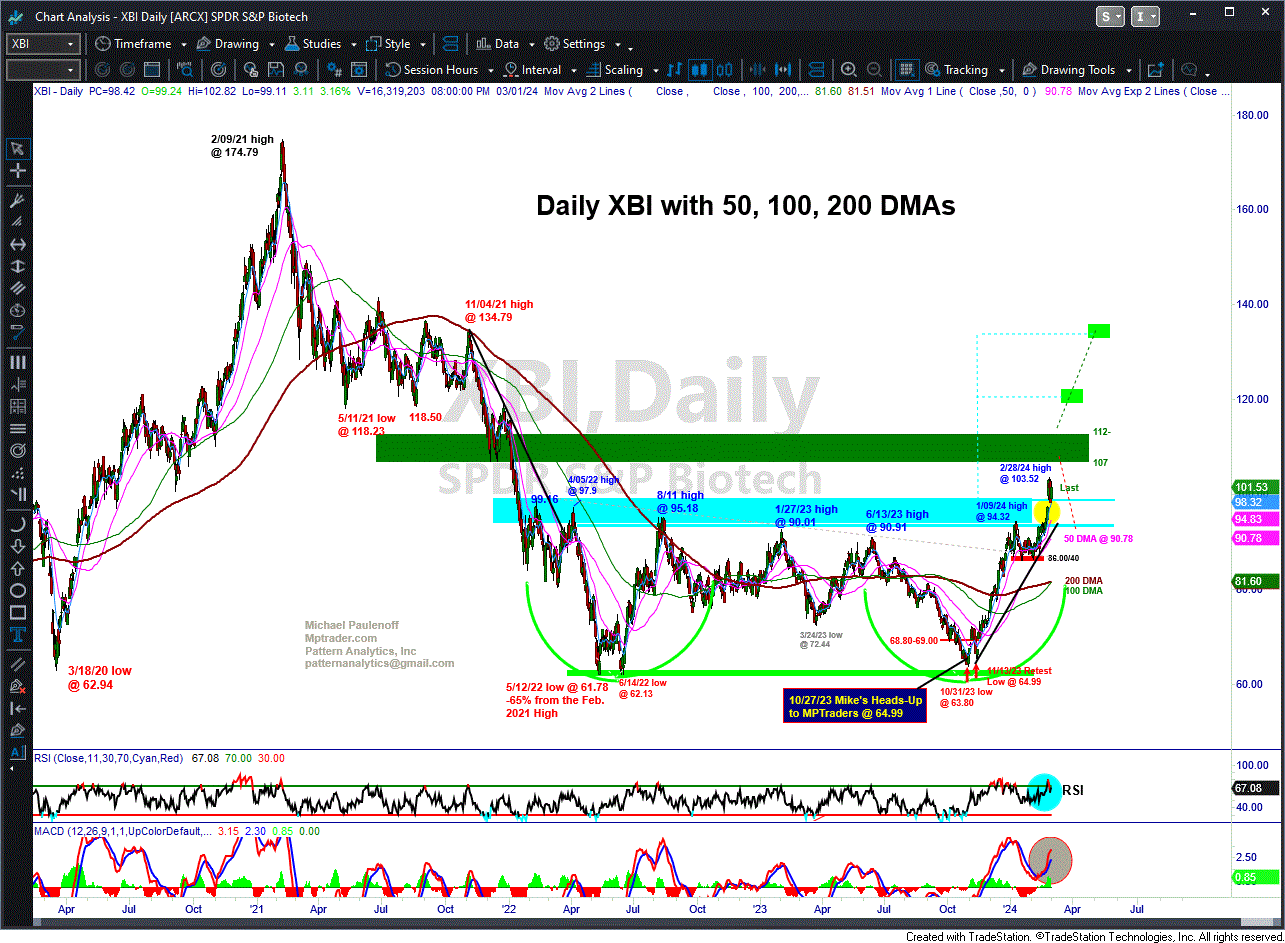
Identifying Breakout Resistance In XBI
On October 27, 2023, Mike Paulenoff discussed his outlook for XBI (SPDR S&P Biotech ETF) with our MPTrader members, writing:
With the exception of a few months of recovery rally price action here and there, XBI remains in the grasp of a major bear phase off of its February 2021 peak at 174.79 into today's 17-month new low at 64.78. The $64,000 question is whether or not XBI is coming in for a successful test of its May-June 2022 lows at 61.78 and 62.13? From my Big Picture perspective, unless and until XBI strength can inflict some technical damage to the dominant current downtrend off of the June 2023 rally peak at 90.91, the bears will remain in directional control, pressing toward a full-fledged test of the 2022 low-zone of 61.78 to 62.13. To inflict damage to the nearest-term downtrend, XBI needs to climb and take out resistance at 68.80-69.00... Last is 64.99...
Mike's attached Daily Chart shows that his heads-up occurred within a few sessions of a climb and close above his initial "damaging" technical resistance level at 68.80-69.00. That was followed by a successful retest of the low (64.99) ahead of a powerful, sustained up-leg in XBI that has emerged from the beginning of November 2023 into last week's high at 103.52, a full 59% above Mike's initial October 27 chart post.
On February 12, Mike posted the following update on XBI:
Fellow member "Blue" asked for an update on my XBI work. This setup looks explosive (finally) after two years of frustration that has turned into a massive (Double) Bottom formation that is pushing up toward a confrontation with a 24-month resistance zone from 94.30 to 96.30 that if (when) hurdled will trigger measured intermediate-term upside Target Window at 120 and 135. Only a bout of weakness that breaks and sustains beneath 86.00-87.00 support (that includes the sharply up-sloping 50 DMA) will neutralize my currently bullish outlook. Last is 92.50...
And most recently, this past Wednesday, February 28, Mike wrote:
XBI (Biotech ETF) continues to act impressively on the upside after it broke out of a two-year base-accumulation period and pattern at 94.80 this past Monday and since, has followed through to an upside high at 103.52 today. My next immediate target zone is 108-112, but intermediate-term upside projections derived from the two-year base formation point to 119-122, and 132-136 thereafter. The nearest support resides from 101.40 to 100... last is 102.60...
What's next for XBI? Higher prices or a pullback? Login this week to join Mike and MPTrader members for their intraday analysis and discussions about the real-time setups in XBI as well as for many other individual stocks, sector ETFs, macro indices, commodities, and Bitcoin.

