Identifying OXY's Opportunistic Setup
Back on June 26th, when nearby WTI Oil futures were circling $67/bbl, Mike Paulenoff issued a heads-up to MPTrader members about a potentially opportunistic technical setup developing in OXY (Occidental Petroleum), writing:
"OXY pressed to a low at 55.58 this AM, which marginally violated the 5/11 low at 56.16, BUT held above the more technically significant March 2023 low at 55.51 prior to pivoting to the upside into positive territory, now trading at 57.47. For all intents and purposes, OXY retested for the second time since mid-March its 55.50 low, and held again, leaving behind a potential Triple Bottom provided any subsequent rally can climb above 59.25 for starters, and then follows through to take out 61.00... Last is 57.46..."
On June 30th, just four sessions later, OXY closed above 59.25 to satisfy Mike's first bullish setup condition, and then on July 12th, OXY closed above 61.00, which satisfied the second higher price parameter Mike's work required to confirm the initiation of a new bull phase in the stock.
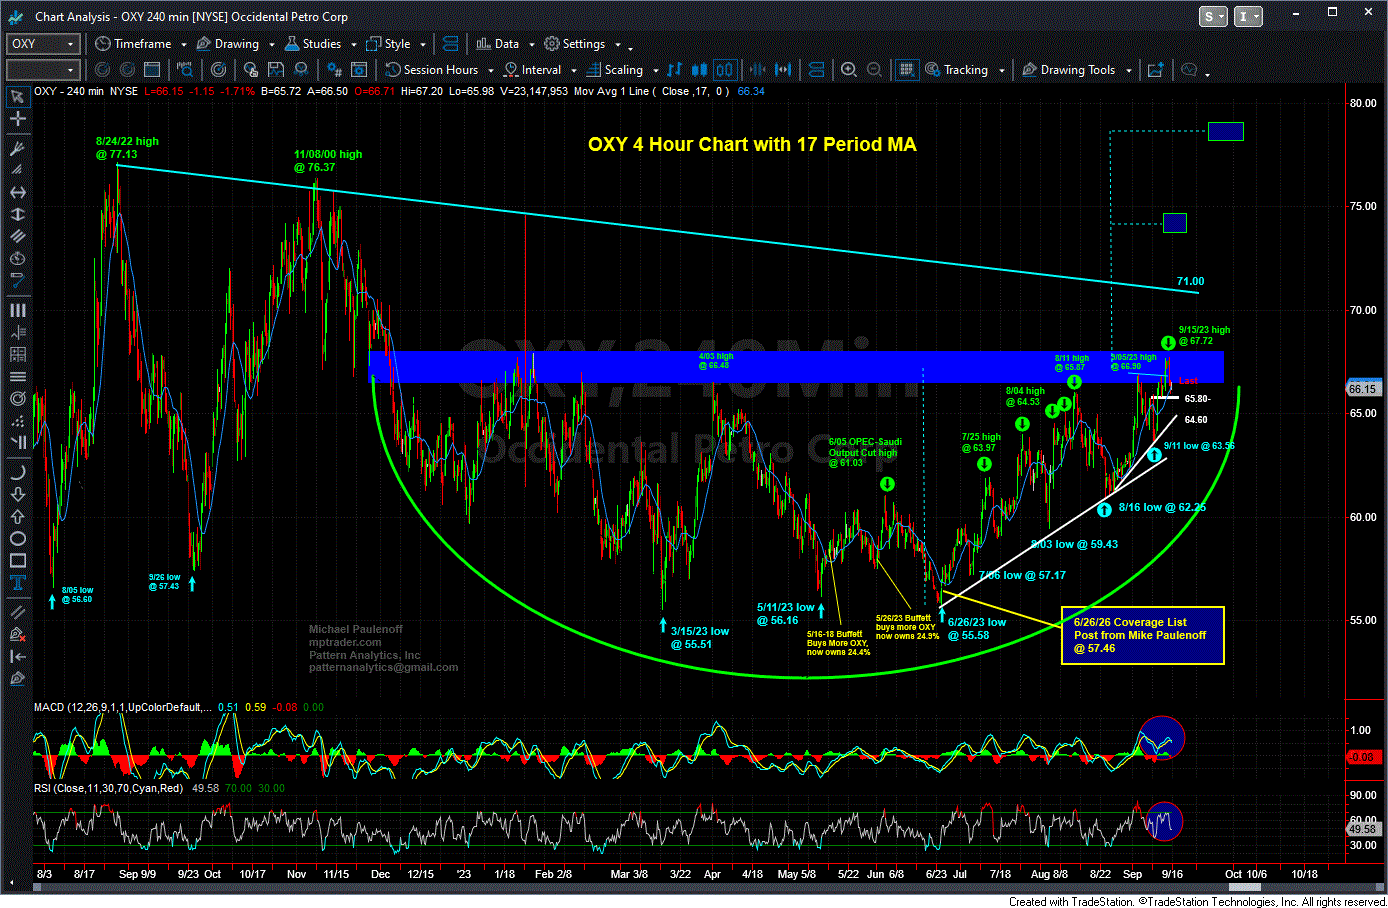
Notwithstanding some intermittent volatility indigenous to OXY's trading profile, the stock never looked back once it satisfied Mike's initial technical "requirements" for a bottoming pattern that morphed into a powerful uptrend pattern of higher highs and higher-lows clearly evident on Mike's attached OXY Chart.
Fast-forward to this past week, OXY hit a 9-month new high at 67.72, a full 18% from Mike's initial heads-up to MPTrader members on June 26th, while nearby WTI NYMEX Oil hit a high of 91.23, a gain of 36%!
After multiple OXY updates that Mike posted to our Coverage List during the upmove, this past Tuesday (Sept 12th) he posted the following ongoing commentary:
"Last Tues (9/05) OXY hit a post-June rally peak at 66.90, and then pulled back to yest's (9/11) low at 63.56. This AM it is higher at 64.50, indicating that the week-long pullback from 66.90 is complete at 63.56, and that OXY is looping up again for another challenge of key multi-month resistance at 66.50-68.00 in route to a target of 70.50-71.00. Only a break below 63.56 will compromise the setup, and will point OXY to a test of its June-Sep. up trendline, now at 62.50... Last is 64.56..."
OXY is an example of Mike Paulenoff identifying a potentially rewarding technical setup for our members for consideration in their own individual portfolios and based on their particular risk profiles. Throughout every trading session, Mike provides multiple updates that combine his technical expertise with supportive background fundamentals to introduce to MPTrader members an individual stock, ETF, macro index, commodity, etc. that his work concludes could be or already is in the process of embarking on a directional price move.
Login to join Mike and MPTrader members in our Discussion Room this coming week ahead of Wednesday's FOMC meeting, interest rate decision, and policy statement that undoubtedly will move stocks and markets.

