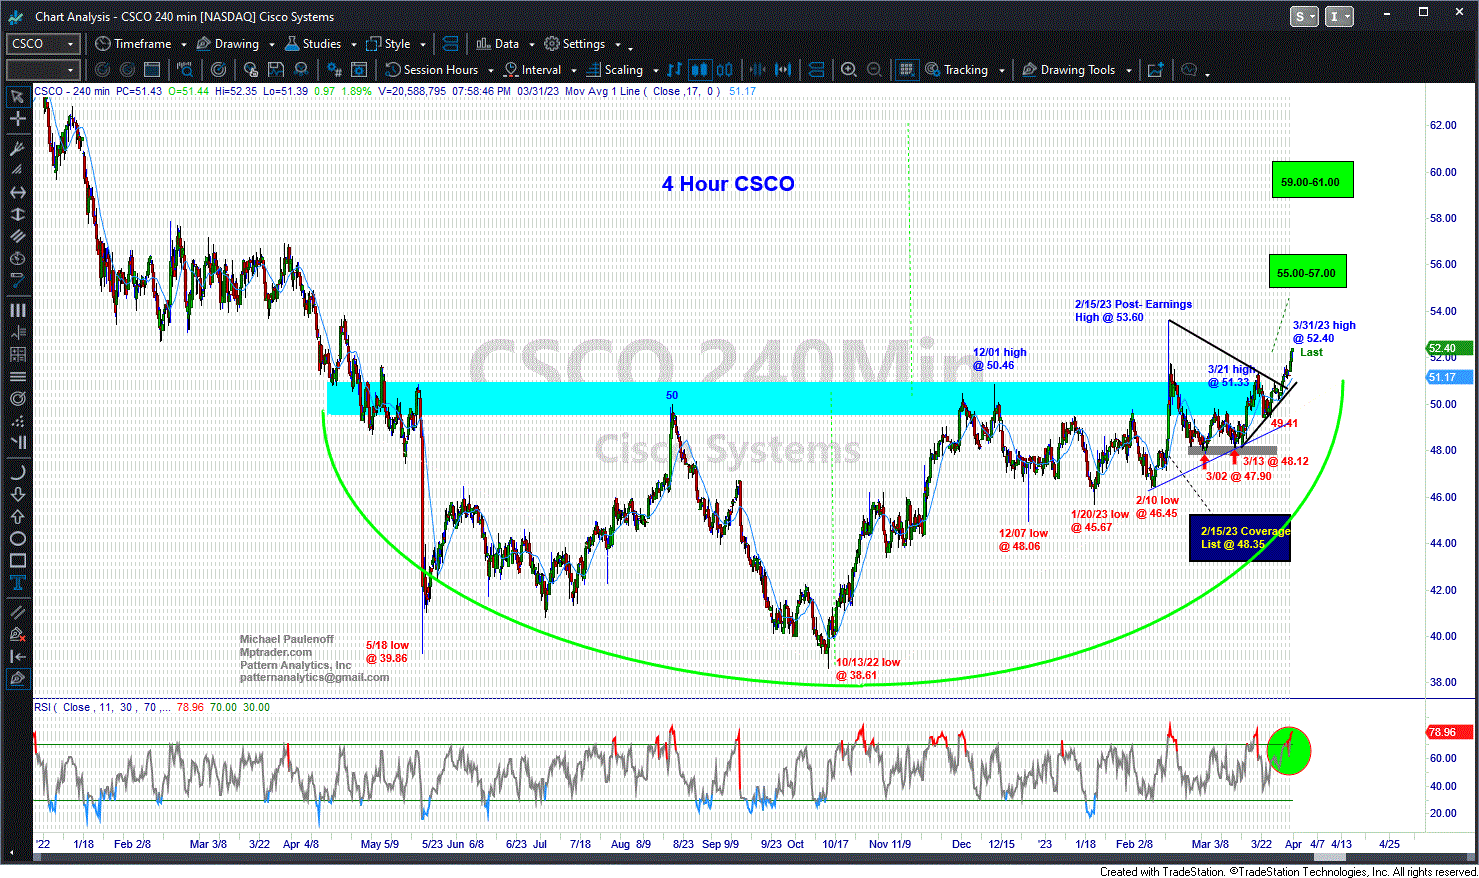
Is CSCO's Setup Poised for Upside Acceleration?

by Mike Paulenoff
April 2, 2023 • 1:56 PM EDT
At the close of Q1, 2023, the big-cap technology names recorded the following very impressive 3-month gains: NVDA +90%, META +76%, TSLA +68%, CRM +50%, AAPL +27%, MSFT +21%, and GOOG +18%.
Although CSCO has lost a bit of its "sex appeal" in recent years and more often than not flies under the radar, the stock was up 10% during Q1, 2023! If its near and intermediate-term technical setup provides us with any indication of what's ahead, then CSCO should be "above the fold" on anyone's shopping list during the remainder of this year.
Indeed, back on Friday, March 24, 2023, with one week remaining in the month and in Q1, 2023, Mike Paulenoff alerted MPTrader members to his technical work in CSCO:
CSCO has been on my radar screen since mid-February just prior to earnings, and as long as any forthcoming weakness is contained above 47.90-48.00, my pattern work argues that CSCO is biding time prior to a powerful upside breakout from a near-1 year base accumulation setup that projects considerably higher later this year... Keep it in mind, even though it no longer has the cache of the mega-techs... Last is 50.32...
Fast-forward to the end of last week (3/31/23). we find CSCO at 52.40, perched right at the high for the day and for the week, up 4% from the prior Friday when Mike posted his chart work to the MPTrader Coverage List and into the MPTrader Discussion Room.
What's next for CSCO? Join Mike and our members for their ongoing intraday conversations about CSCO as well as many other investable opportunistic setups evident and emerging in individual names, ETFs, macro indices, commodities, and Bitcoin. In addition, observe, participate, and learn from their insightful discussions about economic, political, and geopolitical trends that are impacting the financial markets.

Thirty minutes after the opening bell on November 24, 2025, I posted the following heads-up to MPTrader members about the technical setup in META:META has the right technical look of a significant U-Turn to the upside after completing a 27% August-November correction from 796.25 (8/15/25) to 580.32 (11/21/25)... To gain more powerful upside traction, META needs to climb and sustain above nearest-term resistance at 614.70 to 616.50, which if (when) taken out, will open a higher price pathway to the 670 area to challenge the down-sloping 200 DMA... Last is 609.27...
Last Friday morning, to calm frazzled nerves amid a 1% pre-market plunge that was threatening to complete a 100% give back of the prior week's 3.
Late on Friday, fellow MPTrader member MarkinQueens exclaimed: Mike's XOM (Exxon Mobil) chart from August is working! Last $117.26!Back on August 25th, this is what we discussed about Crude Oil and XOM:Just in case anyone is wondering what the chart of nearby Crude Oil is looking like as we approach the "official" end of summer.
On August 12, 2025, this was my response to an inquiry from an MPTrader member about intense weakness impacting SMR (NuScale Power Corp):SMR (NuScale Power)-- Fellow member Irv66 asked for an update on this modular nuclear reactor manufacturer that blasted-off from 11.08 in early April to 53.50 at the end of July (+382%), but has since been in the grasp of a major correction from 53.50 to 38.33 (-28.6%). My pattern work argues that SMR is nearing key support from 37.50 down to 33.
ARKK (ARK Innovation Fund, ETF)-- Back on August 20, 2025, this is what we discussed about ARKK:Fellow member Pawel has requested an update on Cathie Wood's fund, which in June thrust up and out of a 3-1/2 year base-accumulation period and pattern above 68.40/50 that subsequently climbed to my initial target in the vicinity of 80 (see my attached Daily Chart). Since the 7/21/25 high at 79.

