Navigating TSLA's Turns - Market Analysis for Dec 13th, 2020

by Mike Paulenoff
December 13, 2020 • 12:18 PM EST
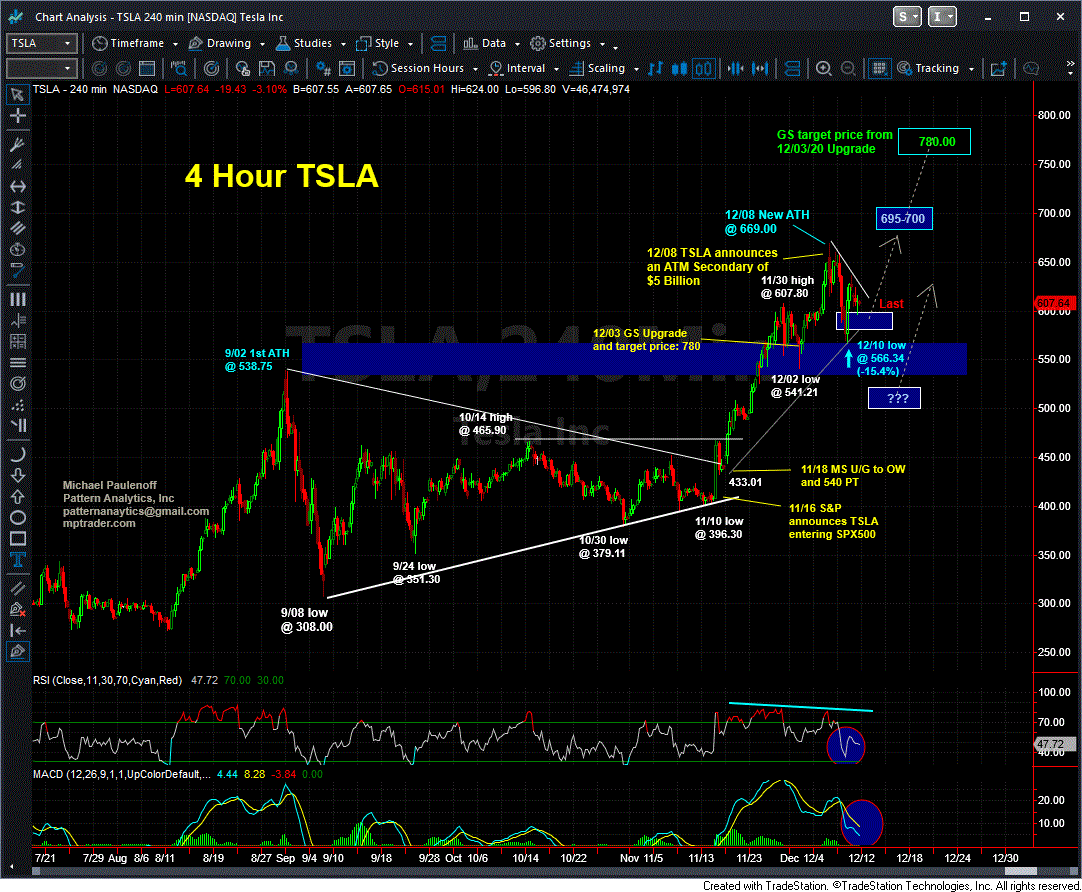
Early on December 3, after Goldman Sachs upgraded TSLA to Buy from Neutral and raised its 12-month target price 780, a full 31% from its then price of 592, Mike Paulenoff wrote MPTrader members:
"I wonder whether or not its (Goldman Sachs) newfound bullishness is a contrary indication, like putting a bull on the cover of Barron's or Time magazine? As for the technical set up in TSLA, my attached chart work argues for a new all time high above 607.80 into the 630 area prior to a meaningful correction into the 500 area, and then, depending on the set-up, maybe TSLA pivots to the upside into a run towards the GS target of 780."
Mike got his expected spike, with TSLA reaching a new regular trading hours high at 654.32 on Wednesday December 9.
Plus he got his expected sell-off and upside pivot, as from there the stock peaked and then corrected to a 566.24 low on Thursday morning, prior to a vicious upside reversal that saw the stock close the week at 609.99. Has TSLA initiated its next powerful upleg that will propel the stock towards Goldman's target of 780?
Join Mike in his live MPTrader room for his forward-looking, out-of-the-box interpretation of TSLA's technical set-ups that inform members' expectations about positioning, risk management, and projected target zones for TSLA as well as for numerous other stocks, ETFs, indices, and commodities.
Mike Paulenoff is the author of MPTrader.com, a real-time diary of his technical analysis & trade alerts
on
ETFs for precious metals, energy, currencies, and an array of equity indices and sectors, including
international
markets, plus key ETF component stocks in sectors like technology, mining, and banking.
Sign up for a Free 7-day Trial!
Thirty minutes after the opening bell on November 24, 2025, I posted the following heads-up to MPTrader members about the technical setup in META:META has the right technical look of a significant U-Turn to the upside after completing a 27% August-November correction from 796.25 (8/15/25) to 580.32 (11/21/25)... To gain more powerful upside traction, META needs to climb and sustain above nearest-term resistance at 614.70 to 616.50, which if (when) taken out, will open a higher price pathway to the 670 area to challenge the down-sloping 200 DMA... Last is 609.27...
Last Friday morning, to calm frazzled nerves amid a 1% pre-market plunge that was threatening to complete a 100% give back of the prior week's 3.
Late on Friday, fellow MPTrader member MarkinQueens exclaimed: Mike's XOM (Exxon Mobil) chart from August is working! Last $117.26!Back on August 25th, this is what we discussed about Crude Oil and XOM:Just in case anyone is wondering what the chart of nearby Crude Oil is looking like as we approach the "official" end of summer.
On August 12, 2025, this was my response to an inquiry from an MPTrader member about intense weakness impacting SMR (NuScale Power Corp):SMR (NuScale Power)-- Fellow member Irv66 asked for an update on this modular nuclear reactor manufacturer that blasted-off from 11.08 in early April to 53.50 at the end of July (+382%), but has since been in the grasp of a major correction from 53.50 to 38.33 (-28.6%). My pattern work argues that SMR is nearing key support from 37.50 down to 33.
ARKK (ARK Innovation Fund, ETF)-- Back on August 20, 2025, this is what we discussed about ARKK:Fellow member Pawel has requested an update on Cathie Wood's fund, which in June thrust up and out of a 3-1/2 year base-accumulation period and pattern above 68.40/50 that subsequently climbed to my initial target in the vicinity of 80 (see my attached Daily Chart). Since the 7/21/25 high at 79.