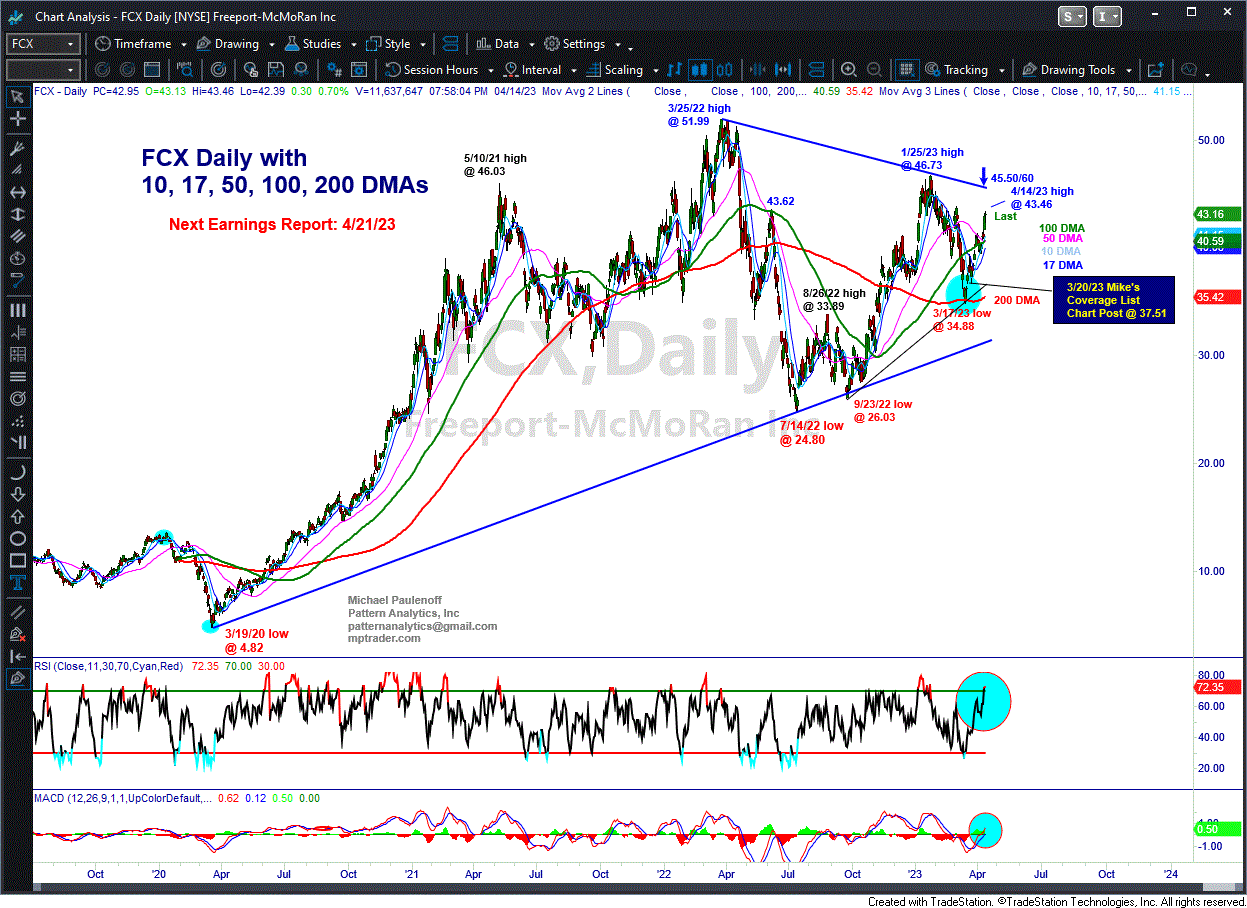
Near-Vertical Price Path By FCX Since Our Alert
by Mike Paulenoff
April 16, 2023 • 1:16 PM EDT
On March 20, I posted the following technical alert to MPTrader members:
"FCX (Freeport-McMoRan)-- Technically, let's notice that FCX appears to be in the U-Turn phase after the completion of a 7-week 25% corrective period that successfully tested the 200 DMA last week. If the commodity complex has fully corrected its post-pandemic-inflationary spiral bull phase (think Crude Oil, down 46% from its 2022 highs), then FCX with its concentration of Copper, Gold, Silver, and Oil is poised for a resurgence of strength... As long as any forthcoming weakness is contained above the 200 DMA (35.12), I am expecting the price structure to challenge key near-term resistance from 39 to 41, where the developing rally pattern will inform us if FCX is in the grasp of a budding new upleg... Last is 37.51..."
Since the alert, FCX went on to climb to a high at 43.46 this past Friday (April 14), a full 15.9% above the level it was trading at when we first alerted MPTrader members, and nearly 25% above its March pivot low at 34.88. See our daily chart below, which shows the near-vertical price path taken by FCX since the update.
Along the way, I posted a half dozen follow-up posts about the upside technical progress of FCX, as well as alerting members to supportive fundamental factors that could provide a compelling background story for a bullish period for the copper market in particular, and for the industrial metals in general. These factors include the demand implications of the re-open of the post-Covid China economy, the relative supply differential of copper globally, underinvestment (Cap-Ex) of the global mining business in new mining ventures, and potentially game-changing demand for copper required to ramp-up the manufacture of EVs around the world.
Indeed, FCX could well be in the sweet spot of a budding bull market for months or years to come.
What's next for FCX ahead of a possible pause in the global rate hike cycle, and especially heading into FCX earnings this coming Friday, April 21?
Join me and our MPTrader member community this week for our constant intraday discussions about the technical and fundamental (macro) setups for FCX as well as for many individual stocks, macro indices, ETFs, commodities, precious metals, and Bitcoin.
Over one month ago, on Monday morning, 9/09/24, I posted the following NVDA update for our members:My near-term pattern work makes a compelling argument that the corrective downleg from the 8/16 high at 131 is nearing downside exhaustion and completion in and around 100 (Friday's low was 100.95). That said, unless and until NVDA climbs above 106.30 to 108.
On August 27, 2024, I reviewed my near and intermediate-term technical setup on copper (gold, silver, oil) producer FCX (Freeport-McMoRan) for MPTrader members, writing:My attached Daily Chart shows the 30% correction from the May 2024 high to the August 2024 low, which my pattern work argues ended the retracement of the first upleg of a new bull phase in FCX that began at the 10/23/23 low of 33.08 and ended at the 5/20/24 high of 55.24. The August 2024 upmove from 39.08 (8/05/24) to 46.
On August 5, hours before its after-market earnings report, Mike Paulenoff posted a bullish alert on AI-juggernaut PLTR, writing:"Bottom Line Technically: As long as any forthcoming weakness on a closing basis remains above key support lodged between 19.60 and 21.50, PLTR has the right look of nearing the completion of the correction from its 7/08/24 high at 29.83, and the initiation of another advance that will extend the upside potential off of a two-year base-accumulation setup."The stock, trading at 23.
Three hours before the July Fed 31, 2024 (FOMC) meeting, I posted the following chart commentary about my technical setup work on 10-year Treasury YIELD and its actionable longer-term Treasury bond ETF, the TLT (20+ Year T-bond, ETF):Heading toward Fed Time, 10-year YIELD and TLT (20+ Year T-bond ETF) certainly appear to be anticipating lower interest rate news or innuendos from the FOMC statement (guidance) and Jay Powell in his post-meeting press conference.
On August 15, with XLV (Healthcare SPDR, ETF) approaching Mike Paulenoff's target zone (noted in an April 18th post), Mike responded to an MPTrader member's question about whether it was "time to sell and find something with more potential?" Mike wrote: "My short answer: no, it is not yet time to sell (although I will never dissuade anyone from taking profits and from ringing the cash register). My pattern and momentum work argue that upside potential extends from 156 to 161.